



Home/产品中心Products/指数策略Index Strategies

团队建设 · 约 30 分钟Team Building · 30 min

指数策略:封顶、保底与演示利率

Index Strategies: Caps, Floors, and the Illustrated Rate

IUL 的现金值怎么长,全看这一块。钱不进股市,进的是债券和期权。 保险公司用指数来算利息,不是拿你的钱去炒股。

Everything about how an IUL's cash value grows sits here. The money goes into bonds and options, not into the market. The index is how the interest is calculated, not where the money is.

幻灯片 · 37 页 · 每页下方附详细讲解Slides · 37 pages · full presenter notes under each ↓ 跳到全文↓ Skip to the full article

指数策略Index Strategies

Presented by Team Rise

各位伙伴好,我们是 Team Rise。今天这一组讲指数策略。IUL 的现金价值怎么长、长多少、什么时候不长, 全在这一块。客户问得最多的几个问题,「我会不会亏」「能赚多少」「为什么这家公司的计划书比那家好看」, 答案也都在这一块。

Hello everyone, we're Team Rise. This set is about index strategies. How an IUL's cash value grows, by how much, and when it doesn't grow at all: it all sits here. The questions clients ask most, "can I lose money," "how much can I make," "why does this carrier's illustration look better than that one," are answered here too.

今天的顺序是这样的:先讲什么是指数、什么是标普 500;再讲 IUL 的核心,上涨封顶、下跌保底, 以及保底背后的「零就是英雄」和「年度重置」;然后讲参与率和国家人寿的几个指数策略; 接着是演示利率,这是新人最容易讲错的地方;再看波动率控制指数的真实表现; 然后是增加利息的条款;最后回答一个客户一定会问的问题:IUL 会不会断保。

Here's the order. First, what an index is and what the S&P 500 is. Then the core of an IUL: a cap on the way up and a floor on the way down, with the two ideas behind the floor, "zero is hero" and the annual reset. Then participation rates and National Life's index strategies. Then the illustrated rate, which is where new agents go wrong most often. Then the real record of the volatility-controlled indices, the interest-boosting riders, and finally the question every client asks sooner or later: can an IUL lapse?

这一组里的封顶、参与率、演示利率都是成稿时的数值,每年都会调。讲给客户之前,以当期产品资料和计划书为准。

The caps, participation rates and illustrated rates in this set are as of writing and change every year. Before quoting any of them to a client, check the current product material and the illustration.

什么是指数?What Is an Index?

衡量一篮子股票的整体表现One number for how a basket of stocks did as a whole

一只股票One stock一个苹果:好坏只看它自己One apple: it rises or falls on its own

→

一篮子股票A basket of stocks一整篮水果:看的是整篮的平均A whole basket: what counts is the average

指数本身不能买卖;IUL 只是拿它来量当年该记多少利息You can't buy an index itself; an IUL only uses it to measure how much interest to credit

先从最基本的讲起:什么是指数?一句话,指数是衡量一篮子股票整体表现的一个数字。

Start with the basics: what is an index? In one sentence, an index is a single number that measures how a basket of stocks did as a whole.

我们在客户面前常用水果来比喻。左边是一个苹果,代表一只股票。买一只股票,它涨你就涨,它跌你就跌, 公司出了事,你的钱也跟着出事。右边是一整篮水果,代表一篮子股票。篮子里有几个坏了,整篮的平均不会差太多; 指数看的就是这一整篮的平均表现。

In front of clients we often use fruit. On the left is a single apple: one stock. Own one stock and you rise and fall with it; if the company runs into trouble, so does your money. On the right is a whole basket of fruit: a basket of stocks. A few bad pieces don't drag the basket's average down much, and an index tracks exactly that average.

讲到这里要顺手说一句,后面会反复用到:指数本身是不能买卖的,它只是一个数字。 IUL 的钱也没有放进这个篮子里。保险公司把保费放进自己的一般账户,主要买债券,再拿一小部分买期权; 指数只是一把尺子,用来量今年该给保单记多少利息。

Add one point here, because we'll come back to it again and again: an index can't be bought or sold; it's just a number. An IUL's money isn't in the basket either. The carrier puts premiums into its general account, mostly in bonds, with a small slice spent on options. The index is only a ruler for measuring how much interest the policy gets this year.

互动设计Interaction

可以先问在座的伙伴:「你身边有人买过单只股票亏钱的吗?」大部分人都会举手。 再问:「那买整个市场的人呢?」从这里引到指数。

Ask the room first: "Do you know anyone who lost money on a single stock?" Most hands go up. Then: "And people who bought the whole market?" That leads into indexes.

指数举例说明Three Indexes You Already Know

指数Index篮子里装的What's in the basket代表公司Familiar names
上证指数Shanghai Composite上交所上市的股票Stocks listed in Shanghai工商银行、中国移动、建设银行、贵州茅台ICBC, China Mobile, CCB, Kweichow Moutai
恒生指数Hang Seng香港市场的代表性大公司Hong Kong's leading companies阿里巴巴、京东、美团、小米Alibaba, JD.com, Meituan, Xiaomi
标普 500S&P 500美国 500 多家领先上市公司500-plus leading US companies英伟达、苹果、微软、亚马逊Nvidia, Apple, Microsoft, Amazon

某一时点的快照,排名随股价变动A snapshot at one point in time; rankings move with share prices

指数有很多,我们挑三个华人客户最熟悉的来讲。

There are many indexes. We'll use the three our Chinese-speaking clients know best.

第一个是上证指数,衡量的是在上海证券交易所上市的股票。按市值排,靠前的是工商银行、中国移动、 建设银行、贵州茅台、农业银行这些大家天天听到的名字,银行和能源的分量很重。

First, the Shanghai Composite, which measures stocks listed on the Shanghai exchange. By market value the leaders are ICBC, China Mobile, China Construction Bank, Kweichow Moutai and Agricultural Bank of China, names everyone hears daily. Banks and energy carry a lot of weight.

第二个是恒生指数,香港市场最有代表性的指数。里面有阿里巴巴、京东、美团、小米、理想汽车这些公司, 近些年科技和消费类的比重越来越大。

Second, the Hang Seng, Hong Kong's benchmark. It includes Alibaba, JD.com, Meituan, Xiaomi and Li Auto, and technology and consumer names have grown in weight over recent years.

第三个就是我们今天的主角,标普 500,美国 500 多家领先上市公司。权重最大的是英伟达、苹果、微软、 亚马逊、谷歌,下一页专门讲。

Third, today's main subject, the S&P 500: more than 500 leading US public companies. The heaviest are Nvidia, Apple, Microsoft, Amazon and Alphabet; the next slide covers it in detail.

这三个放在一起讲,是想让客户明白一件事:指数就是「一篮子」,篮子装什么,决定了它长成什么样。 同样叫指数,上证、恒生、标普这些年的走势差别很大。所以选哪一个指数来给保单记利息,不是小事。

Putting the three side by side makes one point for the client: an index is a basket, and what's in the basket decides how it behaves. All three are "indexes," yet their paths over the years have been very different. So which index a policy credits against is not a small matter.

讲师提醒Presenter note

成分股排名和权重每天都在变,这一页只当「某一时点的快照」来讲,不要报具体市值或权重。 也不要借这一页评价哪个市场「更值得投资」,我们讲的是记息的尺子,不是投资建议。

Rankings and weights change daily, so present this as a snapshot and don't quote market values or weights. Don't use the slide to say which market is "better to invest in" either; we're talking about a crediting ruler, not giving investment advice.

什么是标普 500?What Is the S&P 500?

  • 按市值加权:公司越大,分量越重Market-cap weighted: the bigger the company, the more it counts
  • 美国 500 多家领先上市公司500-plus leading US public companies
  • 1957 年推出,最常被引用的美股指数之一Launched in 1957, one of the most quoted US indexes
  • IUL 记息一般只看价格涨幅,不含分红IUL crediting usually uses the price index, without dividends
#公司Company权重Weight
1Nvidia7.15%
2Apple6.24%
3Microsoft4.97%
4Amazon4.12%
5Alphabet A3.42%
6Alphabet C3.18%
7Meta2.82%
8Tesla2.51%
9Broadcom2.49%
10Berkshire Hathaway1.66%

前 10 大成分股:某一时点的快照,权重随股价每天变动Top 10 constituents: a snapshot at one point in time; weights move daily

标普 500 是什么?它是一个按市值加权的指数,由美国 500 多家领先的上市公司组成。 为什么是「500 多家」而不是正好 500 家?因为有的公司有两类股票,比如谷歌的 A 股和 C 股都在里面,所以股票数会略多于 500。

What is the S&P 500? It's a market-cap-weighted index of more than 500 leading US public companies. Why "more than 500"? Because some companies have two share classes in it, such as Alphabet's A and C shares, so the count of stocks runs slightly above 500.

按市值加权的意思是:公司越大,在指数里的分量越重。右边这张表是某一时点的前十大成分股: 英伟达占 7.15%,苹果 6.24%,微软 4.97%,前十家加起来大约占四成。所以这几家大公司涨跌,对指数的影响最大。

Market-cap weighting means the bigger the company, the more it counts. The table on the right is a snapshot of the top ten at one point in time: Nvidia 7.15%, Apple 6.24%, Microsoft 4.97%, and the top ten together around 40%. So the moves of these few giants matter most to the index.

标普 500 是 1957 年推出的,今天全世界看美国股市,最常引用的就是它。客户一听就知道是什么, 这也是绝大多数 IUL 都拿它当主要记息指数的原因。

The S&P 500 was launched in 1957, and today it's the measure most often quoted for the US market. Clients recognise it instantly, which is a big reason most IULs use it as their main crediting index.

最后一点很重要:IUL 记息一般只看标普的价格涨幅,不含分红。我们平时在新闻里看到的 「标普一年涨了多少」有时是含分红的总回报,两个口径差一两个百分点。后面看历史数据时,要记得这个区别。

One last, important point: IUL crediting generally uses the S&P's price change, without dividends. The "S&P returned X% this year" in the news is sometimes total return including dividends, and the two differ by a point or two. Keep that in mind whenever we look at history later on.

讲师提醒Presenter note

原稿说标普 500 是「世界历史最悠久、回报最稳定的指数之一」。不要这样讲:道琼斯比它早, 标普自己也有大起大落的年份。讲「1957 年推出、最常被引用」就够了。

The original slide called the S&P 500 "one of the oldest, most stable-returning indexes in the world." Don't say that: the Dow is older, and the S&P has had plenty of sharp swings. "Launched in 1957 and among the most quoted" is enough.

500+ 家上市公司500-Plus Companies

衡量美国整体股市表现的最佳指标之一One of the best single measures of the US stock market

板块Sector代表公司Familiar names
科技Technology微软、苹果、英伟达、博通Microsoft, Apple, Nvidia, Broadcom
通讯服务Communication谷歌、Meta、NetflixAlphabet, Meta, Netflix
消费Consumer亚马逊、特斯拉、沃尔玛、CostcoAmazon, Tesla, Walmart, Costco
金融Financials摩根大通、伯克希尔、VisaJPMorgan, Berkshire, Visa
医疗、能源、工业……Healthcare, energy, industrials…礼来、强生、埃克森美孚……共 11 个板块Eli Lilly, J&J, ExxonMobil… 11 sectors in all

原稿这一页是一张美股的「热力图」:每个方块是一家公司,方块越大,市值越大。我们这里换成一张表, 把客户最熟悉的名字按板块列出来。

The original slide was a US market "heat map": each tile a company, bigger tiles for bigger market values. Here we've turned it into a table that lists the names clients know best, by sector.

科技有微软、苹果、英伟达;通讯服务有谷歌、Meta;消费有亚马逊、特斯拉、沃尔玛;金融有摩根大通、伯克希尔; 再往下还有医疗、能源、工业,一共 11 个板块。客户每天用的手机、电脑、搜索、网购、加油、买药,背后几乎都是这个篮子里的公司。

Technology has Microsoft, Apple and Nvidia; communication services has Alphabet and Meta; consumer has Amazon, Tesla and Walmart; financials has JPMorgan and Berkshire; then healthcare, energy, industrials and more, eleven sectors in all. The phone, computer, search engine, online shopping, petrol and medicine a client uses every day almost all come from companies in this basket.

所以我们说标普 500 是衡量美国整体股市表现的最佳指标之一。它不是押某一家公司、某一个行业, 而是押美国经济里最大、最有竞争力的那一批公司整体往前走。

That's why we call the S&P 500 one of the best single measures of the US market. It isn't a bet on one company or one industry; it follows the largest, most competitive group of companies in the US economy as a whole.

互动设计Interaction

让客户自己说三个每天用到的美国品牌,再告诉他这三家大概率都在标普 500 里。比我们念名单有效得多。

Ask the client to name three American brands they use every day, then point out that all three are very likely in the S&P 500. Far more effective than reading out a list.

标普 500 公司变更The S&P 500 Keeps Changing

加入标普 500Added

  • PayPal · 2015 年 7 月Jul 2015
  • Activision Blizzard · 2015 年 8 月Aug 2015
  • Twitter · 2018 年 6 月Jun 2018
  • Etsy · 2020 年 9 月Sep 2020
  • Tesla · 2020 年 12 月Dec 2020
  • NXP · 2021 年 3 月Mar 2021
  • Moderna · 2021 年 7 月Jul 2021
  • Airbnb、Blackstone · 2023 年 9 月Sep 2023
  • DoorDash · 2025 年 3 月Mar 2025

从标普 500 移除Removed

  • Yahoo · 2017 年 6 月Jun 2017
  • Staples · 2017 年 9 月Sep 2017
  • Macy's · 2020 年 4 月Apr 2020
  • Harley-Davidson · 2020 年 6 月Jun 2020
  • Lincoln National、Newell · 2023 年 9 月Sep 2023
  • Qorvo · 2024 年 12 月Dec 2024
  • Celanese、Teleflex、FMC · 2025 年 3 月Mar 2025

这一页讲一个客户往往没想过的事:标普 500 里的公司不是固定的,一直在换。

This slide covers something clients rarely think about: the companies in the S&P 500 aren't fixed; they change all the time.

左边是这些年加进来的:PayPal、Twitter、Tesla、Moderna、Airbnb、Blackstone,2025 年 3 月还有 DoorDash。 右边是被移出去的:Yahoo、Staples、Macy's、Harley-Davidson,2025 年 3 月一次移出了 Celanese、Teleflex、FMC 三家。 被移出的原因各不相同,有的是被收购退市,比如 Staples 和 Yahoo;有的是市值缩水,排不进前面,比如 Macy's 和 Harley-Davidson,2020 年疫情期间被调到了中小盘指数。

On the left are companies added over the years: PayPal, Twitter, Tesla, Moderna, Airbnb, Blackstone, and in March 2025 DoorDash. On the right are companies removed: Yahoo, Staples, Macy's, Harley-Davidson, and in March 2025 Celanese, Teleflex and FMC together. The reasons vary. Some were taken private or acquired, like Staples and Yahoo; others shrank too much to stay near the top, like Macy's and Harley-Davidson, which were moved to smaller-company indexes during the 2020 pandemic.

讲这一页的意思是:指数自带一个更新的机制。掉队的公司出去,新的领头羊进来。 买一只股票,公司衰落了你只能跟着衰落;跟一个指数,篮子里的东西会被定期换新。 这也是为什么长期来看,跟着一个宽基指数比押单只股票稳得多。

The point of the slide: an index has its own renewal mechanism. Laggards leave, new leaders come in. Own one stock and you decline when the company declines; follow an index and the basket is refreshed regularly. That's a big reason why, over the long run, following a broad index is far steadier than betting on one stock.

讲师提醒Presenter note

日期以标普道琼斯指数公司的调整公告为准,按生效月份写。不要说「进了标普就一定涨」, Twitter 进来几年后就因被收购退市了。

Dates follow S&P Dow Jones Indices' change announcements, by effective month. Don't say "getting into the S&P means it will rise"; Twitter was taken private a few years after it joined.

指数策略:指数险 IUL 的核心Index Strategies: the Core of an IUL

+30% −30% 11% 0% 上涨封顶 下跌保底 Cap Floor
指数涨 30% → 记 11%(封顶)Index +30% → credit 11% (cap)
指数跌 30% → 记 0%(保底)Index −30% → credit 0% (floor)

这一页是整个 IUL 最核心的一张图,建议大家都能在白纸上画出来:上涨封顶,下跌保底。

This is the single most important picture in an IUL, and you should be able to draw it on a blank sheet: a cap on the way up, a floor on the way down.

中间两条横线,上面那条是封顶,这个例子是 11%;下面那条是保底,0%。 如果这一年指数涨了 30%,保单不会记 30%,最多记到封顶 11%。如果这一年指数跌了 30%,保单也不会跟着亏 30%, 最差记 0%,停在保底那条线上。

The two horizontal lines: the upper one is the cap, 11% in this example; the lower one is the floor, 0%. If the index gains 30% this year, the policy doesn't credit 30%; it credits at most the 11% cap. If the index loses 30%, the policy doesn't lose 30%; the worst it credits is 0%, sitting on the floor.

中间那段虚线,就是保单每年记息的区间:在 0% 到封顶之间。客户最常问的「我会不会亏」, 答案就在这张图里:指数部分不会记负数。客户第二常问的「能赚多少」,答案也在这张图里:有上限,涨得再多也拿不全。

The dashed segment between them is the range the policy credits each year: from 0% up to the cap. The client's most common question, "can I lose money?", is answered here: the index side never credits a negative. The second most common, "how much can I make?", is answered here too: there's a ceiling, and you never get all of a big year.

这两条线是一起来的。保底不是白给的,封顶就是保底的价钱。保险公司要保证你不亏, 就得放弃一部分上涨。这句话一定要我们自己先说,不要等客户自己发现。

The two lines come as a pair. The floor isn't free; the cap is what the floor costs. For the carrier to guarantee you won't lose, it has to give up part of the upside. Say this yourself, first; don't wait for the client to discover it.

合规提醒Compliance note

「不会亏」只针对指数记息这一部分。保单每个月照扣保险成本和费用,记 0% 的年份现金价值会略降。 讲保底时一定把这句带上。

"Can't lose" applies only to the index credit. The policy still deducts insurance costs and charges every month, so in a 0% year the cash value dips. Always say this alongside the floor.

什么是保底?What Does the Floor Mean?

1

零就是英雄(Zero is Hero)Zero is hero

指数下跌时,这一年记的利息可能是 0%,但不会是负数When the index falls, the year may credit 0%, but never a negative

2

年度重置(Annual Reset)The annual reset

不需要补回下跌的部分:这一年的年终价值,直接成为下一年的起始价值No need to make up the fall: this year's ending value simply becomes next year's starting value

保底这件事,背后有两个概念,接下来几页一个一个讲。

Two ideas sit behind the floor, and the next few slides take them one at a time.

第一个叫「零就是英雄」,Zero is Hero。指数下跌的年份,保单记的利息可能是 0%。 听起来 0% 不算什么好消息,但在大跌的年份,别人亏了三四成,你是 0,这个 0 就是英雄。为什么 0 这么值钱,下一页用数字讲。

The first is "zero is hero." In a year when the index falls, the policy may credit 0%. Zero doesn't sound like good news, but in a crash year, when others are down 30 or 40 percent and you're at zero, that zero is the hero. The next slide shows in numbers why zero is worth so much.

第二个叫年度重置,Annual Reset。股票账户跌了以后,要先涨回原来的位置才算回本; IUL 不用。这一年结束时账户是多少,下一年就从多少开始算,不需要先把指数跌掉的那一段补回来。 这一点后面两页用 1970 年代的真实数据演示。

The second is the annual reset. After a brokerage account falls, it has to climb back to where it was before it's even. An IUL doesn't. Whatever the account holds at the end of this year is where next year starts, with no need to make up the index's fall first. Two slides from now we'll show this with real data from the 1970s.

两个概念加起来,就是 IUL 指数部分的「下有保底」。再强调一次:说的是指数记息不记负数, 不是现金价值永远不减少,保单成本和费用每个月照扣。

Together, the two ideas are what "a floor underneath" means for the index side of an IUL. Once more: they mean the index credit is never negative, not that the cash value can never fall; costs and charges still come out every month.

零就是英雄(Zero is Hero)Zero Is Hero

亏损Loss回本需要涨Gain needed to recover
10%11.1%
20%25%
30%42.9%
40%2008 全年 −38.49%2008: −38.49%66.7%
50%2000–02 高点到低点约 −49%2000–02 peak to trough ≈ −49%100%
60%150%
70%233%

一开始有 $100,000Start with $100,000

亏损 50% → 只剩 $50,000Lose 50% → $50,000 left

要回到 $100,000,需要涨 100%Back to $100,000 takes +100%

  • 2000 年的高点,2007 年才涨回来The 2000 peak was regained in 2007
  • 2007 年的高点,2013 年才涨回来The 2007 peak was regained in 2013

标普 500 价格指数(不含分红);含分红的总回报约早一年回本S&P 500 price index (no dividends); with dividends, recovery came about a year sooner

为什么说 0 是英雄?因为亏损和收益是不对称的。

Why is zero the hero? Because losses and gains are not symmetrical.

看右边这个例子。你一开始有 $100,000,亏了 50%,剩 $50,000。要回到 $100,000,需要涨多少? 很多人第一反应是 50%,其实不对:$50,000 涨 50% 只有 $75,000。要回到 $100,000,需要把钱翻倍,也就是 100% 的收益。

Take the example on the right. You start with $100,000 and lose 50%, leaving $50,000. How much do you need to gain to get back to $100,000? Most people say 50%, and they're wrong: $50,000 up 50% is only $75,000. Getting back to $100,000 means doubling the money, a 100% gain.

左边这张表把这个规律列出来了:亏 10%,要涨 11.1% 才回本;亏 30%,要涨 42.9%;亏 40%,要涨 66.7%; 亏 50%,要涨 100%;亏 70%,要涨 233%。亏得越多,爬回来越难,而且是加速变难。

The table on the left lays out the pattern: lose 10% and you need 11.1% to recover; lose 30%, 42.9%; lose 40%, 66.7%; lose 50%, 100%; lose 70%, 233%. The deeper the loss, the harder the climb, and it gets harder faster.

这不是纸上谈兵,标普 500 自己就经历过。2000 到 2002 年互联网泡沫,标普从高点到低点跌了大约 49%, 差不多就是表里 50% 那一行;2000 年的高点,要到 2007 年才涨回来。2008 年次贷危机,标普全年跌了 38.49%, 对应表里 40% 那一行;2007 年的高点,按价格指数要到 2013 年才涨回来,算上分红大约是 2012 年。 一来一回,就是五六年的时间。

This isn't theory; the S&P 500 has lived it. In the 2000–2002 dot-com bust, the index fell about 49% from peak to trough, roughly the 50% row; the 2000 peak wasn't regained until 2007. In the 2008 crisis the index lost 38.49% for the year, the 40% row; the 2007 peak wasn't regained on the price index until 2013, or about 2012 counting dividends. Each round trip took five or six years.

所以在 IUL 里,大跌的年份记 0,看上去什么都没赚,实际上是躲开了那个要花好几年才能爬出来的坑。这就是 0 是英雄的意思。

So in an IUL, a crash year that credits zero looks like a year of nothing, but it actually skips the hole that takes years to climb out of. That's what "zero is hero" means.

讲师提醒Presenter note

原稿写「08 年次贷危机,2012 年才涨回来」。只看价格指数,标普要到 2013 年 3 月才超过 2007 年 10 月的高点; 2012 年是含分红的口径。IUL 记息看价格指数,所以这里写 2013 年。

The original said the 2008 crisis was "recovered by 2012." On the price index, the S&P didn't pass its October 2007 high until March 2013; 2012 is the with-dividends figure. IUL crediting uses the price index, so we say 2013.

年度重置The Annual Reset

每年的利息都会被锁定Each year's interest is locked in

年份Year标普 500 年涨幅S&P 500 return标普账户价值S&P account年度重置账户价值Annual-reset account
1970–$100,000$100,000
197110.79%$110,790$109,250
197215.63%$128,106$119,356
1973−17.37%$105,854$119,356
1974−29.72%$74,394$119,356 锁定$119,356 locked
197531.55%$97,866$130,396
197619.15%$116,607$142,458

年度重置一列按封顶 9.25%、保底 0% 计算 · 标普为价格涨幅 · 未扣保单费用,仅为说明机制Annual-reset column uses a 9.25% cap and 0% floor · S&P is price return · no policy charges; for illustration of the mechanism only

这一页用 1970 年代的真实数据,演示年度重置是怎么回事。

This slide uses real 1970s data to show what the annual reset does.

假设 1970 年底有两个账户,各放 $100,000。左边的账户直接跟着标普 500 涨跌; 右边的是年度重置账户,规则是:每年最多记 9.25%,最少记 0%,记了就锁定。

Suppose two accounts each start with $100,000 at the end of 1970. The left one moves with the S&P 500; the right one is an annual-reset account with a simple rule: at most 9.25% a year, at least 0%, and whatever is credited is locked in.

1971、1972 两年是好年份,标普涨了 10.79% 和 15.63%,标普账户涨到 $128,106。年度重置账户每年封顶 9.25%, 只到 $119,356,这时候它是落后的。

1971 and 1972 were good years: the S&P rose 10.79% and 15.63%, taking its account to $128,106. The annual-reset account, capped at 9.25% each year, reached only $119,356. At this point it's behind.

接下来是 1973、1974 年石油危机,标普连跌两年,跌 17.37%,再跌 29.72%,标普账户从 $128,106 掉到 $74,394。 年度重置账户呢?两年都记 0,停在 $119,356,锁住了,不动。

Then came the 1973–74 oil crisis. The S&P fell two years running, −17.37% and then −29.72%, and its account dropped from $128,106 to $74,394. The annual-reset account? Zero both years, holding at $119,356: locked, untouched.

最关键的是 1975 年。标普反弹了 31.55%,可标普账户只回到 $97,866,还没回到 1970 年的本金。 年度重置账户不用先补跌掉的部分,直接从 $119,356 往上算,记 9.25%,到 $130,396。 到 1976 年,两边是 $116,607 对 $142,458。

The key year is 1975. The S&P bounced 31.55%, yet its account only got back to $97,866, still below the 1970 starting money. The annual-reset account didn't have to make anything up first; it started straight from $119,356, credited 9.25% and reached $130,396. By 1976 the two stood at $116,607 versus $142,458.

所以年度重置的意思就是:去年年底是多少,今年就从多少开始,跌掉的那一段不用补。 这是 IUL 和股票账户在结构上最大的差别。

That is the annual reset: wherever you ended last year is where you start this year, and the fall never has to be made up. It's the biggest structural difference between an IUL and a brokerage account.

讲师提醒Presenter note

这张表挑的是一段对年度重置特别有利的年份。讲的时候要说明:在连续大涨的年份,比如 1995–1999, 有封顶的账户会明显落后于标普。这张表是用来讲机制,不是说 IUL 一定跑赢标普。 另外原稿没写封顶,这里按表里的数字反推出是 9.25%。

This table picks a stretch that flatters the annual reset. Say so: in long strong runs such as 1995–1999, a capped account falls well behind the S&P. The table explains the mechanism; it doesn't say an IUL beats the S&P. The original didn't state the cap; working back from the figures, it's 9.25%.

年度重置:两条线The Annual Reset: Two Lines

$60K$90K$120K$150K 1970197119721973197419751976 $74,394 $119,356 $142,458 $116,607 石油危机 连跌两年 Oil crisis: two down years
标普 500 账户(虚线)S&P 500 account (dashed) 年度重置账户Annual-reset account

同一组数字,画成两条线。这一页不念数字,只看形状。

The same numbers drawn as two lines. Don't read numbers here; look at the shapes.

虚线是标普账户,起伏很大:先冲上去,1973、1974 年一路往下掉,掉到 $74,394,然后再往回爬。 金色实线是年度重置账户:前两年涨得比标普慢,中间两年是一条水平线,一点都没掉,然后从这条水平线直接往上走。

The dashed line is the S&P account, with big swings: up first, then down through 1973 and 1974 to $74,394, then climbing back. The solid gold line is the annual-reset account: slower than the S&P for the first two years, flat through the middle two without losing anything, then rising straight up from that flat stretch.

请大家注意 1975 年这一段:两条线涨的斜度差不多,但起点不一样。标普是从坑底往上爬, 年度重置是从平台往上走。起点不一样,终点就不一样。

Look at 1975: the two lines climb at a similar slope, but from different places. The S&P climbs out of a hole; the annual reset climbs from a plateau. Different starting points, different finishing points.

在客户面前,这张图比表格好讲。可以这样说:「股市跌的时候,您的账户就停在这条平台上等, 等市场回来,再从平台往上走,不用先爬出那个坑。」

In front of a client this picture is easier than the table. Try: "When the market falls, your account waits on this plateau. When the market comes back, it climbs from the plateau, without first climbing out of the hole."

合规提醒Compliance note

「平台」说的是指数记息不记负数。真实保单在这两年里照扣保险成本和费用,线会略往下斜,不是完全水平。

The "plateau" means the index credit isn't negative. A real policy still pays insurance costs and charges in those two years, so the line would slope down slightly rather than run perfectly flat.

参与率The Participation Rate

年份Year标普涨幅S&P growthCap Focus封顶 9.25% · 参与率 105%cap 9.25% · par 105%Par Focus封顶 6.50% · 参与率 140%cap 6.50% · par 140%1% Floor封顶 6.75% · 参与率 100%cap 6.75% · par 100%
200326.38%9.25%6.50%6.75%
20048.99%9.25%6.50%6.75%
20053.00%3.15%4.20%3.00%
200613.62%9.25%6.50%6.75%
20073.53%3.71%4.94%3.53%
2008−38.49%0.00%0.00%1.00%
200923.45%9.25%6.50%6.75%

3 × 10⁵% = 3.15%  3 × 140% = 4.2%

前面讲了封顶,这一页讲第二个旋钮:参与率。

We've covered the cap. This slide covers the second dial: the participation rate.

参与率的意思是:指数涨了多少,乘以一个比例,才是记给保单的利息。参与率 100%,指数涨 3% 就记 3%; 参与率 105%,指数涨 3% 记 3.15%;参与率 140%,记 4.2%。乘完以后,再看有没有超过封顶,超过了就按封顶算。

The participation rate is a multiplier on the index move: the credit is the index gain times this rate. At 100%, a 3% index year credits 3%; at 105%, 3.15%; at 140%, 4.2%. After multiplying, the result is checked against the cap, and anything above the cap is cut back to the cap.

这张表是一份国家人寿计划书里的历史演示,三个标普 500 策略放在一起。看标亮的 2005 年:标普只涨了 3%, Cap Focus 参与率 105%,记 3.15%;Par Focus 参与率 140%,记 4.2%;1% Floor 参与率 100%,记 3%。 指数涨得少的年份,参与率高的策略占便宜。

This table is the historical illustration from a National Life proposal, with three S&P 500 strategies side by side. Look at the highlighted 2005: the S&P rose only 3%. Cap Focus at 105% credits 3.15%; Par Focus at 140% credits 4.2%; 1% Floor at 100% credits 3%. In small up years, the high-participation strategy wins.

但再看 2003、2006、2009 这几年,标普涨了 13% 到 26%,三个策略都碰到了封顶:Cap Focus 记 9.25%, Par Focus 只有 6.50%,1% Floor 6.75%。大涨的年份,封顶高的策略占便宜。 2008 年标普跌了 38.49%,前两个策略记 0,1% Floor 记 1%,这就是它名字的由来。

Now look at 2003, 2006 and 2009, when the S&P gained 13% to 26%. All three hit their caps: Cap Focus credits 9.25%, Par Focus only 6.50%, 1% Floor 6.75%. In big up years, the high-cap strategy wins. In 2008 the S&P fell 38.49%: the first two credit 0 and the 1% Floor credits 1%, which is where its name comes from.

所以没有哪个策略是全方位最好的,它们是在封顶、参与率、保底三者之间做不同的取舍。下一页把国家人寿的几个策略列出来。

So no strategy is best in every year; each trades cap, participation and floor differently. The next slide lists National Life's strategies.

互动设计Interaction

请大家算 2007 年:标普涨 3.53%,Cap Focus 和 Par Focus 各记多少?(3.53 × 10⁵% ≈ 3.71%, 3.53 × 140% ≈ 4.94%,都没超过封顶。)

Ask the room to work out 2007: the S&P rose 3.53%; what do Cap Focus and Par Focus credit? (3.53 × 10⁵% ≈ 3.71% and 3.53 × 140% ≈ 4.94%, both under their caps.)

讲师提醒Presenter note

这张表的封顶和参与率是较早一份计划书的参数,下下页是现在的参数(Cap Focus 封顶 11%、参与率 100%), 两页的数字不一样是正常的。

This table uses an older proposal's parameters; two slides on are today's (Cap Focus cap 11%, par 100%). The numbers differ between the two, and that's expected.

国家人寿 指数策略National Life's Index Strategies

策略Strategy特点What it trades
S&P 500 Point to Point Cap Focus封顶更高Higher cap
S&P 500 Point to Point Participation Focus参与率更高,封顶低Higher participation, lower cap
S&P 500 Point to Point 1% Floor保底 1%,封顶低1% floor, lower cap
Balanced Trend Point to Point No Cap波动率控制指数,不封顶Volatility-controlled, no cap
US Pacesetter Point to Point No Cap波动率控制指数,不封顶Volatility-controlled, no cap

另有 Basic、Fixed 等固定利率策略 · Point to Point:一年一比,看年初和年末两个点Fixed-rate options such as Basic and Fixed also exist · point to point: one start value and one end value a year

这一页是国家人寿 IUL 里可以选的指数策略。前三个都跟标普 500,后两个跟的是波动率控制指数。

These are the index strategies available in National Life's IULs. The first three follow the S&P 500; the last two follow volatility-controlled indexes.

先解释名字里都有的「Point to Point」,点对点:保单每一段从某一天开始,一年后同一天结束, 只看这两个点的指数差多少,中间怎么涨跌都不管。

First, the "point to point" in every name: each segment starts on a given day and ends on the same day a year later, and only the index levels at those two points matter, however it moved in between.

三个标普策略的区别,就是上一页讲的取舍。Cap Focus 封顶更高; Participation Focus 参与率更高,但封顶低;1% Floor 把保底从 0% 抬到 1%,代价是封顶低。

The three S&P strategies differ in exactly the trade-offs from the last slide. Cap Focus has the higher cap; Participation Focus has a higher participation rate but a lower cap; 1% Floor lifts the floor from 0% to 1%, at the cost of a lower cap.

后两个,Balanced Trend 和 US Pacesetter,不封顶,参与率也更高,听上去最诱人。 但它们跟的不是标普 500,而是波动率控制指数。这两个指数的真实表现,我们后面会用专门几页来看。 先剧透一句:不封顶不等于涨得多。

The last two, Balanced Trend and US Pacesetter, have no cap and higher participation rates, which sounds the most attractive. But they don't follow the S&P 500; they follow volatility-controlled indexes. We'll spend several slides on how those indexes actually performed. A spoiler for now: no cap does not mean more growth.

讲师提醒Presenter note

每个策略的封顶和参与率每年会调整,不同产品也不一样。报数字之前,看当期的费率表和客户自己的计划书。

Each strategy's cap and participation rate change every year and vary by product. Check the current rate sheet and the client's own illustration before quoting a number.

标普 500 指数策略:20 年回看S&P 500 Strategies: Twenty Years Back

年份Year标普S&PCapPar1% Floor
20053.00%3.45%4.83%3.45%
200613.62%11.85%9.10%9.35%
20073.53%4.06%5.68%4.06%
2008−38.49%0.00%0.00%1.15%
200923.45%11.85%9.10%9.35%
201012.78%11.85%9.10%9.35%
20110.00%0.00%0.00%1.15%
201213.41%11.85%9.10%9.35%
201329.60%11.85%9.10%9.35%
201411.39%11.85%9.10%9.35%
年份Year标普S&PCapPar1% Floor
2015−0.73%0.00%0.00%1.15%
20169.54%10.39%9.10%9.35%
201719.42%11.85%9.10%9.35%
2018−6.24%0.00%0.00%1.15%
201928.88%11.85%9.10%9.35%
202016.26%11.85%9.10%9.35%
202126.89%11.85%9.10%9.35%
2022−19.44%0.00%0.00%1.15%
202324.23%11.85%9.10%9.35%
202423.31%11.85%9.10%9.35%
几何平均Geometric average标普S&PCap FocusPar Focus1% Floor
近 5 年5 years12.70%9.37%7.22%7.66%
近 10 年10 years11.10%8.01%6.29%6.82%
近 15 年15 years11.70%8.46%6.60%7.10%
20 年20 years8.20%7.88%6.37%6.68%

计划书历史演示:现在的参数加 Enhancer 加成,套 2005–2024 年标普价格涨幅 · 非保证A proposal's historical illustration: today's parameters plus the Enhancer bonus on 2005–2024 S&P price returns · not guaranteed

这一页是现在的参数,套过去 20 年标普的真实涨跌,看三个标普策略每年各记多少。 数字来自计划书里的历史演示页,是回看,不是哪一张真实保单的记录。

This slide applies today's parameters to the S&P's actual moves over the last twenty years, showing what each of the three S&P strategies would have credited. The figures come from a proposal's historical illustration page: a look back, not any real policy's record.

先说清楚一个细节:这份计划书选了 Enhancer,所以表里的数字都含 Enhancer 的加成。 Cap Focus 本身封顶 11%,加成最多 0.85%,所以好年份显示 11.85%;Par Focus 封顶 8.25%,加成后 9.10%; 1% Floor 封顶 8.5%,加成后 9.35%,保底 1% 加成后 1.15%。

One detail first: this proposal elected the Enhancer, so every figure includes the Enhancer bonus. Cap Focus's own cap is 11%, and the bonus adds at most 0.85%, so strong years show 11.85%. Par Focus caps at 8.25%, 9.10% with the bonus; 1% Floor caps at 8.5%, 9.35% with the bonus, and its 1% floor becomes 1.15%.

再看最下面的几何平均。20 年下来,Cap Focus 是 7.88%,Participation Focus 是 6.37%,1% Floor 是 6.68%。 5 年、10 年、15 年的平均,也都是 Cap Focus 最高。封顶更高的标普 500 策略,长期平均回报更高。

Now the geometric averages at the bottom. Over twenty years Cap Focus comes to 7.88%, Participation Focus 6.37%, 1% Floor 6.68%. Over 5, 10 and 15 years Cap Focus is also the highest. The higher-cap S&P 500 strategy has had the better long-run average.

为什么?看标亮的五个下跌年份,2008、2011、2015、2018、2022:Cap Focus 记 0,1% Floor 记 1.15%, 1% Floor 每次多拿一点点。但其余十五年里,有很多年标普涨了 20% 以上,Cap Focus 每年比另外两个多记 2.5 到 2.75 个百分点。 多出来的这些,远远超过下跌年份那一点保底的差别。

Why? Look at the five highlighted down years, 2008, 2011, 2015, 2018 and 2022: Cap Focus credits 0 and 1% Floor 1.15%, a small edge each time. But in the other fifteen years the S&P often rose more than 20%, and Cap Focus credited 2.5 to 2.75 points more than the other two. That extra far outweighs the small floor advantage in the down years.

最后,诚实地看第一列:20 年标普的几何平均是 8.20%,比任何一个 IUL 策略都高。 IUL 换来的是下跌年份不记负数,拿走的是好年份封顶以上的那一段。

Finally, read the first column honestly: the S&P's twenty-year geometric average is 8.20%, higher than any IUL strategy. What the IUL buys is no negative years; what it gives up is everything above the cap in the good years.

合规提醒Compliance note

这是用现在的参数回看历史,不是保证,也不代表以后。表里 IUL 各列没有扣保险成本和保单费用。 不要把 7.88% 单独说成「这个产品的回报」。

This applies today's parameters to history; it's not a guarantee or a forecast, and the IUL columns don't deduct insurance or policy costs. Never present 7.88% on its own as "this product's return."

20 年里,13 年涨幅超过 8.5%Thirteen of Twenty Years Above 8.5%

20053.00%
200613.62%
20073.53%
2008−38.49%
200923.45%
201012.78%
20110.00%
201213.41%
201329.60%
201411.39%
2015−0.73%
20169.54%
201719.42%
2018−6.24%
201928.88%
202016.26%
202126.89%
2022−19.44%
202324.23%
202423.31%

高封顶,才吃得到这 13 年Only a high cap captures these 13 years

标普 500 价格涨幅,2005–2024 · 8.5% 是 Participation Focus 和 1% Floor 的封顶S&P 500 price returns, 2005–2024 · 8.5% is roughly where Participation Focus and 1% Floor cap out

上一页的结论,换一个更直观的看法。这里把过去 20 年标普每一年的涨幅排开,金框的是涨幅超过 8.5% 的年份, 一共 13 年。

Here's the last slide's conclusion seen more directly. Each of the last twenty years' S&P returns is laid out, and the gold-framed ones are the years above 8.5%: thirteen of them.

为什么挑 8.5% 这条线?因为 Participation Focus 和 1% Floor 的封顶大约就在 8.25% 到 8.5%。 这 13 年里,这两个策略都被封顶卡住了,只有封顶 11% 的 Cap Focus 能多拿一段。20 年里有 13 年是这样, 差距就是这么积累出来的。

Why 8.5%? Because Participation Focus and 1% Floor cap out at roughly 8.25% to 8.5%. In these thirteen years both of them hit their caps, and only Cap Focus, capped at 11%, collected more. Thirteen years out of twenty is how the gap builds up.

同时也看一下没有框的七年:2008、2011、2015、2018、2022 是跌或持平,2005、2007 是小涨。 小涨的年份,参与率高的策略记得多一点;跌的年份,1% Floor 多拿 1%。这些都是真的,只是加起来比不上那 13 年。

Look at the seven unframed years too: 2008, 2011, 2015, 2018 and 2022 were down or flat, and 2005 and 2007 were small gains. In small-gain years the high-participation strategy credits a bit more; in down years 1% Floor gets its extra 1%. All true, but together they don't match those thirteen years.

给客户讲的时候,重点不在推荐哪个策略,而在让客户明白:每个策略都在做取舍,选择之前要知道放弃的是什么。

With a client, the point isn't to push one strategy; it's to make clear that every strategy is a trade, and you should know what you're giving up before you choose.

合规提醒Compliance note

历史上 13 年超过 8.5%,不代表以后也会这样。策略选择要看客户自己的风险偏好,并写进需求分析。

Thirteen years above 8.5% in the past doesn't mean the same ahead. Strategy choice depends on the client's own risk preferences and belongs in the needs analysis.

演示利率The Illustrated Rate

AG49 规范 IUL 的演示利率(Illustration Rate)AG49 regulates the illustrated rate on IULs

1

谁定的Who

美国保险监督官协会 NAIC 的精算指引第 49 号Actuarial Guideline 49 from the NAIC, the state insurance regulators' association

2

什么时候When

2015 年通过,后来又有 49-A(2020)、49-B(2023)两次修订Adopted in 2015, revised as 49-A (2020) and 49-B (2023)

3

管什么What

计划书最多能按多高的利率演示,让各家公司的计划书口径一致The highest rate an illustration may assume, so carriers' illustrations are consistent

4

为了什么Why

保护保单持有人、公平竞争、方便客户比较Protect policyholders, level the field, make comparison easier

接下来讲演示利率,英文叫 Illustration Rate,就是计划书上假设保单每年平均记多少利息。 这一块是新人最容易讲错、也最容易被同业钻空子的地方。

Next, the illustrated rate: the average annual credit an illustration assumes. This is where new agents go wrong most often, and where competitors find the most room to play games.

演示利率不是代理人或者保险公司随便填的,它受 AG49 约束。AG49 是美国保险监督官协会 NAIC 的第 49 号精算指引,2015 年通过。目的写得很清楚:保护保单持有人,让各家公司公平竞争,让客户更容易比较不同的计划书。

The illustrated rate isn't a number the agent or the carrier picks freely; it's constrained by AG49, the NAIC's Actuarial Guideline 49, adopted in 2015. Its purpose is spelled out: protect policyholders, create a level playing field, and make it easier for clients to compare illustrations.

为什么要管?因为在 AG49 之前,有的公司计划书按很高的利率演示,现金价值看上去很漂亮,客户以为一定能做到。 AG49 规定了演示利率的上限要按指数的历史表现和期权成本来算。之后又有 49-A、49-B 两次修订,把一些绕开规定的做法也堵上了。

Why regulate it? Because before AG49 some carriers illustrated at very high rates, the cash values looked wonderful, and clients assumed they were assured. AG49 ties the maximum illustrated rate to the index's history and the cost of the options behind it. Two revisions since, 49-A and 49-B, closed some of the ways around the rules.

但要注意:AG49 管的是上限,不是统一一个数。每家公司、每个策略的演示利率还是不一样。 接下来几页看几家公司的实际演示利率,以及这个数字对计划书的影响有多大。

But note: AG49 sets a ceiling, not a single number. Each carrier and each strategy still illustrates at a different rate. The next slides look at several carriers' actual illustrated rates, and at how much that one number moves an illustration.

演示利率:每家公司不一样Illustrated Rates Differ by Carrier

National Life

策略Strategy当前演示利率Current illustrated
Basic / Fixed-Term3.50%
US Pacesetter PTP No Cap6.81%
Balanced Trend PTP No Cap6.81%
S&P 500 PTP Cap Focus6.81%
S&P 500 PTP Participation Focus5.64%
S&P 500 PTP 1% Floor5.55%

Symetra

指数Index最高演示利率Max illustrated
S&P 5007.00%
Nasdaq-1007.21%
JPMorgan ETF Efficiente 56.35%
标普 + JPM 混合S&P + JPM blend6.31%

各公司计划书节选,成稿时数值 · 国家人寿另有「替代演示利率」一栏,统一按 3.50%Excerpts from carriers' illustrations, as of writing · National Life also shows an "alternative" column at 3.50% for every strategy

这一页把两家公司的演示利率放在一起看。

This slide puts two carriers' illustrated rates side by side.

左边是国家人寿。固定利率的 Basic 和 Fixed-Term 策略按 3.50% 演示;标普 Cap Focus 和两个波动率控制指数 都是 6.81%;Participation Focus 5.64%;1% Floor 5.55%。注意同一家公司,不同策略的演示利率也不一样, 封顶高的策略演示利率高,这和前面 20 年回看的结论是对得上的。

On the left, National Life. The fixed Basic and Fixed-Term strategies illustrate at 3.50%; S&P Cap Focus and both volatility-controlled indexes at 6.81%; Participation Focus at 5.64%; 1% Floor at 5.55%. Even within one carrier the rates differ by strategy, and the higher-cap strategy illustrates higher, which matches the twenty-year look-back.

国家人寿的计划书右边还有一栏「替代演示利率」,所有策略统一按 3.50% 再演示一遍, 让客户看到利率低的时候保单会怎么样。这一栏要指给客户看。

National Life's illustration also carries an "alternative" column that reruns every strategy at 3.50%, so the client can see how the policy behaves if rates are low. Point that column out to the client.

右边是 Symetra。标普 500 最高演示 7.00%,Nasdaq-100 是 7.21%,JPMorgan 的 ETF Efficiente 5 指数 6.35%。 光看数字,Symetra 比国家人寿高了 0.2 到 0.4 个百分点。

On the right, Symetra. S&P 500 at a maximum of 7.00%, Nasdaq-100 at 7.21%, JPMorgan ETF Efficiente 5 at 6.35%. On the numbers alone, Symetra is 0.2 to 0.4 points above National Life.

这 0.2 到 0.4 个百分点意味着什么?后面几页会看到,演示利率差一点点,计划书上的保费和现金价值就会差一大截。 所以拿演示利率去比两家公司,是在比假设,不是在比产品。

What do 0.2 to 0.4 points mean? As the next slides show, a small difference in the illustrated rate moves the illustrated premium and cash value a long way. So comparing two carriers by illustrated rate compares assumptions, not products.

演示利率:F&GIllustrated Rates: F&G

记息选项Crediting option回看平均Look-back avg.最低–最高min–max当前封顶Current cap或差价or spread最高Max演示利率illustrated
标普 500 年度点对点,参与率 100% 有封顶S&P 500 annual PtP, 100% par with cap4.62% – 9.26%12.50%7.19%
标普 500 年度点对点,参与率 140% 有封顶S&P 500 annual PtP, 140% par with cap4.39% – 8.15%9.50%6.37%
标普 500 月度点对点有封顶S&P 500 monthly PtP with cap3.98% – 9.97%4.00%6.91%
Barclays Trailblazer Sectors 5,参与率 190% 有差价Barclays Trailblazer Sectors 5, 190% par with spread8.57% – 16.54%0.00%6.91%
道琼斯美国房地产风险控制 10%DJ US Real Estate Risk Control 10%4.53% – 17.52%1.10%6.91%
固定利率Fixed rate––4.75%

F&G 计划书节选,成稿时数值Excerpt from an F&G illustration, as of writing

再看一家,F&G。它的计划书把每个选项的「回看平均」也列出来了,正好可以说明演示利率是怎么来的。

One more carrier: F&G. Its illustration also lists each option's "look-back average," which shows nicely where an illustrated rate comes from.

看第一行,标普 500 年度点对点,参与率 100%,当前封顶 12.5%。用现在的封顶和参与率去套历史, 不同的回看区间算出来的平均,最低 4.62%,最高 9.26%。最后能用在计划书上的最高演示利率是 7.19%。 演示利率就是在这个范围里,按 AG49 的规则算出来的一个数。

Take the first row: S&P 500 annual point to point, 100% participation, current cap 12.5%. Applying today's cap and participation to history over different look-back windows gives averages from 4.62% to 9.26%. The highest rate the illustration may use is 7.19%. The illustrated rate is a number worked out inside that range under AG49's rules.

第四行很值得讲:Barclays Trailblazer Sectors 5,回看平均高达 8.57% 到 16.54%,但最高演示利率也只有 6.91%。 这说明 AG49 起作用了:不管回测多漂亮,演示利率都被压在一个上限以内。反过来也提醒我们, 回测数字漂亮的指数,往往是新指数,后面讲 US Pacesetter 时会看到这件事。

Row four is worth a word: Barclays Trailblazer Sectors 5 has look-back averages of 8.57% to 16.54%, yet its maximum illustrated rate is still 6.91%. That's AG49 at work: however good the back-test, the illustrated rate stays under a ceiling. It's also a reminder that indexes with beautiful back-tests are usually new ones, which we'll see with US Pacesetter.

最高的这一档 7.19%,比国家人寿的 6.81% 高 0.38 个百分点。下一家会更高。

The top figure, 7.19%, is 0.38 points above National Life's 6.81%. The next carrier goes higher still.

演示利率:Transamerica 7.7%Illustrated Rates: Transamerica at 7.7%

Transamerica Financial Foundation IUL

标普 500 账户封顶S&P 500 account cap13.75%
全球指数账户封顶Global index account cap15.00%
最高演示利率Max illustrated rate7.70%
指数账户保证最低Index account floor0.75%

比国家人寿 Cap Focus 的 6.81% 高约 0.9 个百分点About 0.9 points above National Life Cap Focus's 6.81%

计划书「Narrative Summary」页节选:$500,000 保额,月缴 $285 · 成稿时数值From the illustration's Narrative Summary: $500,000 face, $285 a month · as of writing

第三家,Transamerica。这是它的 Financial Foundation IUL 计划书的说明页。

The third carrier, Transamerica: the narrative summary page of a Financial Foundation IUL illustration.

标普 500 账户封顶 13.75%,全球指数账户封顶 15%,指数账户的保底是 0.75%。最关键的是这一行: 最高演示利率 7.70%。这是我们今天看到的几家里最高的,比国家人寿的 6.81% 高了将近 0.9 个百分点。

S&P 500 account cap 13.75%, global index account cap 15%, index account floor 0.75%. The key line is this one: maximum illustrated rate 7.70%, the highest of the carriers we've seen today, almost 0.9 points above National Life's 6.81%.

同一个客户,同样的保额,一份按 6.81% 演示,一份按 7.70% 演示,哪一份看上去更好?当然是 7.70% 那一份: 保费更低,现金价值更高。但这是因为它假设得更高,不是因为它一定做得到。

Same client, same face amount: one illustration at 6.81%, another at 7.70%. Which looks better? The 7.70% one, of course: lower premium, higher cash value. But that's because it assumes more, not because it's sure to deliver more.

差不到一个百分点,计划书能差多少?下面三页用国家人寿 Living Life Defender 的计划书,换几个演示利率给大家看。

How much can less than one point change an illustration? The next three slides rerun a National Life Living Life Defender illustration at a few different rates.

讲师提醒Presenter note

讲同业的数字只为说明演示利率的作用,不评价同业产品好坏,也不要在客户面前说别家「虚高」。 演示利率高可能有它的理由,比如封顶更高、期权预算更多。

We show other carriers' figures only to explain what the illustrated rate does, not to judge their products; never tell a client another carrier is "inflated." A higher rate may have reasons, such as a higher cap or a larger option budget.

演示利率 5%、6%、6.44%Illustrated at 5%, 6% and 6.44%

  • 女性,40 岁Female, age 40
  • 身故保额 $100 万$1M death benefit
  • Living Life DefenderLiving Life Defender
  • 只改演示利率Only the rate changes
演示利率Illustrated rate所需月缴Monthly premium一年Per year前 10 年合计First 10 years
5%$885.95$10,631$106,314
6%$687.30$8,248$82,476
6.44%$622.26$7,467$74,671

演示利率从 5% 提到 6.44%,月缴少了 约 30%From 5% to 6.44%, the monthly premium falls by about 30%

计划书节选:Elite 非吸烟,加州 · 当前假设栏 · 非保证Illustration excerpts: Elite non-tobacco, California · current-assumption column · not guaranteed

原稿这里是三页,一页加一个数字,我们合成一页讲。

The original built this up over three pages, one number at a time; here it's one slide.

同一个客户:40 岁女性,Elite 非吸烟,加州,身故保额 $100 万,产品是 Living Life Defender。 三份计划书只改了一个地方:演示利率。问题是:要维持这 $100 万的保额,每个月要存多少?

One client: a 40-year-old woman, Elite non-tobacco, California, $1 million death benefit, Living Life Defender. Three illustrations differ in one thing only: the illustrated rate. The question each answers: how much a month does it take to carry that $1 million?

按 5% 演示,每月要 $885.95,一年 $10,631,前十年合计 $106,314。按 6% 演示,每月 $687.30, 前十年 $82,476。按 6.44% 演示,每月只要 $622.26,前十年 $74,671。

At 5%, it takes $885.95 a month, $10,631 a year, $106,314 over the first ten years. At 6%, $687.30 a month, $82,476 over ten years. At 6.44%, only $622.26 a month, $74,671 over ten years.

从 5% 到 6.44%,演示利率只高了 1.44 个百分点,月缴就少了大约 30%,前十年少存三万多。 保单还是那张保单,变的只是假设。

From 5% to 6.44%, the illustrated rate rose just 1.44 points and the monthly premium fell by about 30%, more than $30,000 less over ten years. The policy is the same policy; only the assumption changed.

这就是为什么客户拿着两家公司的计划书来问「为什么那家便宜这么多」,我们第一件事是看两边的演示利率是不是一样。 如果不一样,就把两份放在同一个演示利率下重新比。

That's why, when a client brings two carriers' illustrations and asks "why is that one so much cheaper?", the first thing to check is whether both use the same illustrated rate. If not, rerun them at the same rate before comparing.

合规提醒Compliance note

按较低的演示利率设计保费,是给保单留余地;按最高演示利率设计,实际记息一旦低于假设,就可能要补钱。 设计方案时把这一点讲给客户,并写在需求分析里。

Funding at a lower illustrated rate leaves the policy a margin; funding at the maximum means that if actual credits fall short, more premium may be needed. Explain this when designing the case and note it in the needs analysis.

演示利率 和 现金价值Illustrated Rate and Cash Value

  • 女性,40 岁Female, age 40
  • 身故保额 $100 万$1M death benefit
  • 每年存 $6 万,存 4 年$60,000 a year for 4 years
演示利率Illustrated rate65 岁账户价值Value at 6585 岁账户价值Value at 85
5%$650,272$1,841,138
6%$833,925比 5% 多 28%+28% vs 5%$2,866,887比 5% 多 56%+56% vs 5%
6.44%$928,619比 5% 多 43%+43% vs 5%$3,468,087约为 5% 的 1.9 倍about 1.9× the 5% figure

时间越长,差距越大:差 1.44 个百分点,85 岁时接近翻倍The longer the horizon, the wider the gap: 1.44 points nearly doubles the value at 85

计划书演示数字,非保证,不是收益承诺Illustrated figures, not guaranteed and not a promise of returns

上一页是反着看:同样的保额,演示利率越高,保费越低。这一页正着看:同样的保费,演示利率越高,现金价值越高。

The last slide ran it backwards: same death benefit, higher rate, lower premium. This one runs it forwards: same premium, higher rate, higher cash value.

还是 40 岁女性、$100 万保额,这次每年存 $6 万,存 4 年,一共 $24 万。按 5% 演示,65 岁时账户价值 $650,272, 85 岁 $1,841,138。按 6%,65 岁 $833,925,85 岁 $2,866,887。按 6.44%,65 岁 $928,619,85 岁 $3,468,087。

Again a 40-year-old woman with a $1 million death benefit, this time funding $60,000 a year for four years, $240,000 in all. At 5%, the account shows $650,272 at 65 and $1,841,138 at 85. At 6%, $833,925 and $2,866,887. At 6.44%, $928,619 and $3,468,087.

看差距怎么变。65 岁时,6% 比 5% 多 28%;到 85 岁,多 56%。6.44% 比 5%,65 岁多 43%,到 85 岁差不多是 1.9 倍。 时间越长,差距越大,到了高龄阶段,拉开的不是「差一点」,而是接近「差一倍」。

Watch the gap grow. At 65, 6% is 28% ahead of 5%; by 85, 56% ahead. 6.44% versus 5% is 43% ahead at 65 and nearly 1.9 times at 85. The longer the horizon, the wider the gap; at advanced ages it isn't "a little more," it's close to double.

这一页想让大家记住两件事。第一,演示利率高的方案在纸面上永远更好看; 第二,纸面好看不等于将来做得到。演示利率只是假设,实际记息每年都不一样。 给客户讲方案时,一定把较低演示利率下的数字也给他看,比如国家人寿计划书里那一栏 3.50%。

Two things to take away. First, a higher illustrated rate always looks better on paper. Second, looking better on paper doesn't mean it will happen. The illustrated rate is an assumption, and actual credits vary every year. When presenting a design, always show the client the figures at a lower rate too, such as the 3.50% column in National Life's illustrations.

讲师提醒Presenter note

原稿写「演示利率每提高 1% 左右,高龄阶段差一倍」,按表里的数算说过头了:5% 到 6%,85 岁多 56%; 5% 到 6.44%,差 1.44 个百分点,才接近一倍(1.88 倍)。讲的时候用表里的实数。

The original said "each extra point or so doubles the value at advanced ages," which overstates the table: 5% to 6% adds 56% at 85, and it takes the 1.44-point step from 5% to 6.44% to come close to double (1.88×). Use the table's actual figures.

波动率控制指数Volatility-Controlled Indexes

策略Strategy跟的是Follows
S&P 500 Point to Point Cap Focus标普 500S&P 500
S&P 500 Point to Point Participation Focus标普 500S&P 500
S&P 500 Point to Point 1% Floor标普 500S&P 500
Balanced Trend Point to Point No Cap波动率控制指数A volatility-controlled index
US Pacesetter Point to Point No Cap波动率控制指数A volatility-controlled index

回到国家人寿的五个策略。前三个跟标普 500,我们已经讲完了。这一部分讲后两个:Balanced Trend 和 US Pacesetter,它们跟的是波动率控制指数。

Back to National Life's five strategies. The first three follow the S&P 500, and we've covered them. This section covers the last two, Balanced Trend and US Pacesetter, which follow volatility-controlled indexes.

这两个策略名字里都写着「No Cap」,不封顶,参与率也比标普策略高。很多新人一看就觉得这是最好的选项, 客户听到「不封顶」也很心动。所以这一部分我们要花几页,把它们讲透:什么是波动率,它们是怎么组成的, 还有最重要的,它们推出以后真实的表现怎么样。

Both have "No Cap" in their names and higher participation rates than the S&P strategies. Many new agents take them for the best option at a glance, and clients light up at "no cap." So we'll spend several slides on them: what volatility is, how these indexes are built, and most importantly how they have actually performed since launch.

什么是波动率?What Is Volatility?

波动率较小:一路慢慢往上Volatility low: a steady climb
波动率较大:大起大落Volatility high: big swings

波动率:价格上下起伏的幅度Volatility: how widely the price swings up and down

示意图,不是某个具体指数的走势Schematic, not any particular index

先讲什么是波动率。原稿这里用了两张真实的行情图,我们换成示意图,意思一样。

First, what volatility is. The original used two real price charts; we've redrawn them as schematics with the same meaning.

左边这条线,一路往上,中间有小的起伏,但起伏不大,这叫波动率较小。 右边这条线,大涨大跌,一会儿冲上去,一会儿掉下来,这叫波动率较大。 波动率说的就是价格上下起伏的幅度,跟最后涨了多少是两回事。

The line on the left climbs with small wiggles along the way: low volatility. The line on the right lurches up and down: high volatility. Volatility measures how widely the price swings; it's a different thing from how much it ends up gaining.

为什么保险公司关心波动率?因为 IUL 的利息是靠买期权来的。指数波动越大,期权越贵; 期权越便宜,同样的预算就能买得越多,给客户的参与率就能越高,甚至不封顶。 波动率控制指数就是为这个设计的:想办法把波动压低,让期权变便宜。

Why does the carrier care? Because IUL interest is funded by buying options. The more volatile the index, the more expensive the options. Cheaper options mean the same budget buys more, which funds a higher participation rate or even no cap. Volatility-controlled indexes are designed for exactly that: hold volatility down so the options get cheaper.

但请记住这一句,后面的数据都是在证明它:波动压低了,涨幅通常也跟着压低。 参与率高、不封顶,是拿一个涨得慢的标的换来的。

But remember this sentence, because the data that follows proves it: when volatility is held down, the gains usually are too. A high participation rate and no cap are bought with an underlying that moves less.

三类记息指数Three Kinds of Crediting Index

US Pacesetter

美国市场US markets

  • 混合多种资产,削平极端涨跌Mixes asset classes to smooth out extreme highs and lows
  • 波动低,所以参与率可以给得高Lower volatility allows higher participation

Balanced Trend

全球市场Global markets

  • 同样是波动率控制Also volatility-controlled
  • 不保证记息更高,甚至不保证有记息No guarantee of higher, or any, interest

S&P 500

美国大公司US large companies

  • 代表美国大型公司股票Represents large-company US stocks
  • 按自己的判断,选更高参与率或更高封顶Choose higher participation or a higher cap, by outlook

三类都有保底 · 据国家人寿产品资料整理All three carry a floor · summarised from National Life product material

这一页来自国家人寿自己的产品资料,把三类记息指数放在一起:左边两个是波动率控制指数,右边是标普 500。三类都有保底。

This page comes from National Life's own product material and puts the three kinds of crediting index together: two volatility-controlled indexes on the left and the S&P 500 on the right. All three have a floor.

US Pacesetter 跟美国市场,Balanced Trend 跟全球市场。资料里对它们的描述是: 混合多种资产和市场,帮助削平指数表现里的极端高点和低点;波动更低,带来更稳定的回报和更低的风险, 所以通常可以给出比其他选项更高的参与率。

US Pacesetter follows US markets; Balanced Trend follows global markets. The material describes them as tracking a mix of asset classes and markets to help smooth out extreme highs and lows in index performance, with lower volatility supporting more consistent returns and reduced risk, generally allowing higher declared rates than other options.

但请大家一定读到资料里的最后一句,原文是:No guarantee that a volatility control index will result in higher, or any, interest crediting. 不保证波动率控制指数会带来更高的记息,甚至不保证会有任何记息。 这句话是公司自己写的,讲的时候要照念。

Make sure to read the last line of the material too: "No guarantee that a volatility control index will result in higher, or any, interest crediting." That's the carrier's own wording, and it should be read out as written.

右边的标普 500,资料的说法是:代表美国大型公司的股票;你可以按自己对指数的看法,选更高的参与率,或者更高的封顶, 也就是前面讲的 Participation Focus 和 Cap Focus。

For the S&P 500 on the right, the material says it represents large-company US stocks, and you can choose a higher participation rate or a higher cap depending on your outlook: the Participation Focus and Cap Focus strategies from earlier.

US Pacesetter:推出之前都是模拟US Pacesetter: Simulated Before Launch

2021 年 12 月 10 日正式推出,在此之前的表现都是假设性(模拟)数据Launched on 10 December 2021; everything before that date is hypothetical, simulated data

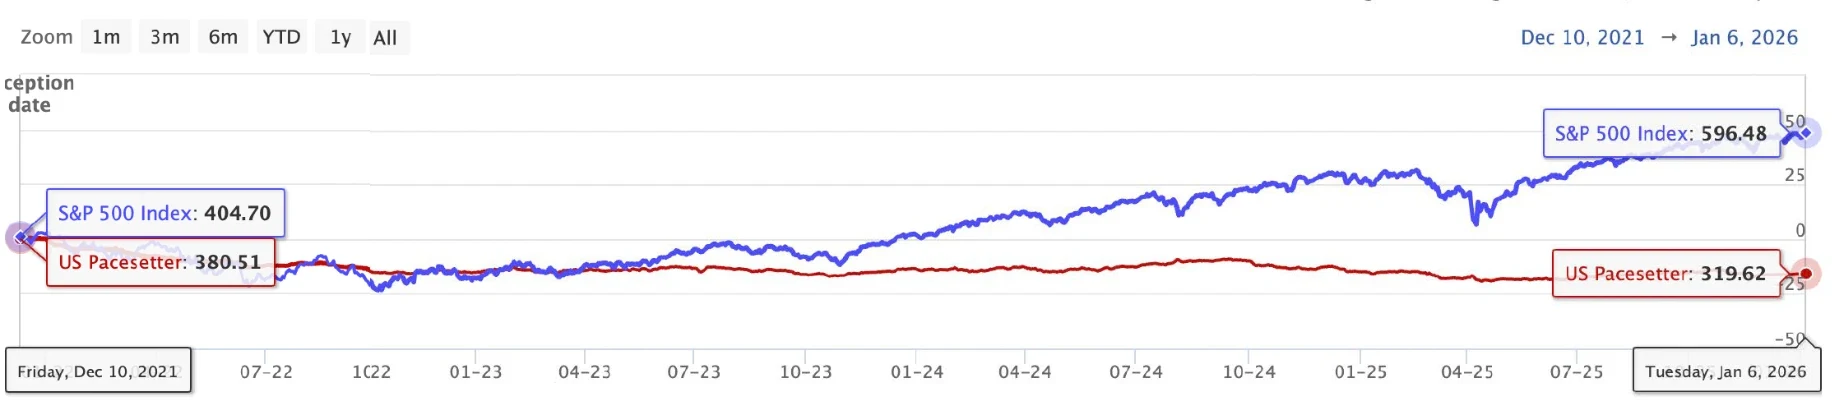
US Pacesetter 与标普 500 的指数走势,2002 年 3 月至 2026 年 1 月:2021 年 12 月推出日之前,US Pacesetter(浅红,模拟)一直走在标普 500(蓝)上方;推出之后,标普 500 继续上涨,US Pacesetter(深红)走平略降 / US Pacesetter versus the S&P 500, March 2002 to January 2026: before the December 2021 inception date the simulated US Pacesetter line (light red) runs above the S&P 500 (blue); after launch the S&P keeps rising while US Pacesetter (dark red) goes flat to slightly down
红:US Pacesetter(推出前浅色为模拟)· 蓝:标普 500 · 竖线:推出日 · 2002 年 3 月–2026 年 1 月Red: US Pacesetter (lighter before launch = simulated) · blue: S&P 500 · vertical line: inception · Mar 2002–Jan 2026
模拟期:红线一直在标普上方Before launch (simulated): red above the S&P throughout
实盘期:红线走平略降After launch (live): red goes flat, then dips

先看 US Pacesetter。这张图是它和标普 500 从 2002 年到 2026 年初的走势。红线是 US Pacesetter,蓝线是标普 500, 中间那条竖线写着 Inception date,推出日,2021 年 12 月 10 日。

Start with US Pacesetter. This chart shows it against the S&P 500 from 2002 to early 2026. The red line is US Pacesetter, the blue line the S&P 500, and the vertical line marked "inception date" is the launch: 10 December 2021.

请大家注意:竖线左边二十年的红线,都不是真的。这个指数 2021 年底才存在, 之前的表现是用它的规则回头模拟出来的,叫假设性数据。你看模拟的那二十年,红线一直走得比标普还好,又稳又高。

Note this: the twenty years of red line to the left of that vertical line aren't real. The index didn't exist until late 2021; everything before is its rules applied backwards, which is called hypothetical data. And look how the simulated twenty years went: the red line ran above the S&P, steadier and higher.

再看竖线右边,真正上线以后:蓝线标普一路往上,红线走平,还略往下。模拟的时候比标普好, 真实的时候比标普差得多。这不是巧合。一个新指数在设计的时候,规则本来就是按过去的数据调出来的, 回测好看是可以做到的;真正经得住考验的,只有推出以后的实盘。

Now the right side, after real launch: the blue S&P keeps climbing, while the red line goes flat and slightly down. Simulated, it beat the S&P; live, it fell far behind. That isn't a coincidence. When a new index is designed, its rules are tuned on past data, so a good-looking back-test is achievable. The only real test is the live record after launch.

合规提醒Compliance note

给客户看任何新指数的历史图表,都要先指出推出日在哪里、哪一段是模拟。不能把回测数据说成「过去 20 年的表现」。

When showing a client any new index's history, point out the launch date and which part is simulated first. Never describe back-tested data as "its performance over the last 20 years."

US Pacesetter:三种市场阶段US Pacesetter: Three Market Phases

增长期GrowthRisk-on过渡期IntermediateTransitional收缩期ShrinkingRisk-reduced
风险偏好Risk appetite高High中Moderate低Low
标普 500 期货S&P 500 futures50%15%5%
10 年期美国国债期货10-year US Treasury futures30%65%75%
大宗商品期货(多 / 空)Commodity futures (long/short)20%20%20%

按股票、债券信号判断所处阶段,再换配置 · 据指数说明资料整理Equity and bond signals pick the phase, which sets the mix · summarised from the index description

这一页讲 US Pacesetter 是怎么组成的。它里面装的不是股票,而是三种期货:标普 500 期货、10 年期美国国债期货、 大宗商品期货。

This slide shows what US Pacesetter is made of. It doesn't hold stocks but three kinds of futures: S&P 500 futures, 10-year US Treasury futures, and commodity futures.

它按股票和债券的信号,判断市场处在哪个阶段,再换配置。增长期,风险偏好高,标普期货占 50%, 国债 30%,商品 20%。过渡期,标普降到 15%,国债升到 65%。收缩期,标普只剩 5%,国债占 75%。 商品期货三个阶段都是 20%,可以做多也可以做空。

It reads equity and bond signals to decide which phase the market is in, then changes the mix. In the growth phase, risk appetite is high: 50% S&P futures, 30% Treasuries, 20% commodities. In the intermediate phase, S&P falls to 15% and Treasuries rise to 65%. In the shrinking phase, S&P is down to 5% and Treasuries are 75%. Commodity futures stay at 20% throughout, long or short.

所以要跟客户讲清楚:US Pacesetter 大部分时候不是一个股票指数, 在过渡期和收缩期,它七八成的分量是国债期货。它的波动低,就是因为股票的比例被压得很低。 股市涨的时候,如果它判断还在过渡期,就只吃到 15% 的股票涨幅。

So be clear with clients: much of the time US Pacesetter isn't a stock index at all. In the intermediate and shrinking phases, 65% to 75% of it is Treasury futures. Its low volatility comes precisely from keeping the stock share low. When stocks rally while it still reads "intermediate," it captures only a 15% slice of the stock gain.

2022 年股债双杀,股票和国债一起跌;之后股市大涨,它又没跟上。下一页就是这几年的实盘结果。

In 2022 stocks and bonds fell together; after that, stocks surged and it didn't keep up. The next slide shows the live results for those years.

US Pacesetter:推出后 4 年US Pacesetter: Four Years Live

标普 500 · 404.70 → 596.48S&P 500 · 404.70 → 596.48+47.4%
US Pacesetter · 380.51 → 319.62US Pacesetter · 380.51 → 319.62−16.0%
2021 年 12 月 10 日至 2026 年 1 月 6 日:标普 500(蓝)从 404.70 涨到 596.48,US Pacesetter(红)从 380.51 降到 319.62 / 10 December 2021 to 6 January 2026: the S&P 500 (blue) rises from 404.70 to 596.48 while US Pacesetter (red) falls from 380.51 to 319.62
2021 年 12 月 10 日–2026 年 1 月 6 日 · 蓝:标普 500 · 红:US Pacesetter · 图中数值为指数资料页的换算值10 Dec 2021–6 Jan 2026 · blue: S&P 500 · red: US Pacesetter · values as shown on the index data page

这一页只看推出以后的四年,2021 年 12 月 10 日到 2026 年 1 月 6 日。

This slide shows only the four years since launch: 10 December 2021 to 6 January 2026.

蓝线标普 500,从 404.70 涨到 596.48,涨了 47.4%。红线 US Pacesetter,从 380.51 跌到 319.62, 跌了 16%。四年下来,一个涨了将近一半,一个亏了六分之一。

The blue S&P 500 went from 404.70 to 596.48, up 47.4%. The red US Pacesetter went from 380.51 to 319.62, down 16%. Over four years, one gained almost half; the other lost a sixth.

对保单来说意味着什么?点对点策略每年只看年初和年末两个点。指数四年净跌 16%, 一年一比的结果多半是负的或很小,保单这几年记的多半是 0 或很少。参与率再高,乘的是负数或零, 结果还是零;不封顶,可是根本没涨到需要封顶的地方。

What does that mean for a policy? A point-to-point strategy looks only at the start and end of each year. With the index down 16% over four years, the year-by-year results were mostly negative or small, so the policy credited zero or very little in most of those years. A high participation rate times a negative or zero is still zero; no cap, but it never rose far enough to need one.

这一页是我们主动讲给客户听的,比藏着强。客户迟早会自己查到,与其那时候解释,不如现在先说。 而且这本身就是选标普 500 策略最有力的理由。

This is something we raise with clients ourselves; saying it beats hiding it. A client will find it eventually, and explaining afterwards is worse than explaining first. It's also the strongest single argument for the S&P 500 strategy.

讲师提醒Presenter note

原稿写「S&P 500 Growth:+47.38%」。图里那条线是标普 500 指数本身(按资料页的换算值),不是另一个叫 S&P 500 Growth 的成长股指数,这里写「标普 500」。四年也只是一段时间,下一页换一个指数、再后面换一张对账单,结论一样。

The original said "S&P 500 Growth: +47.38%." The line on the chart is the S&P 500 itself (as rebased on the data page), not the separate S&P 500 Growth style index, so we say "S&P 500." Four years is one window; the next slide uses another index, and a later one a policy statement, with the same conclusion.

Balanced TrendBalanced Trend

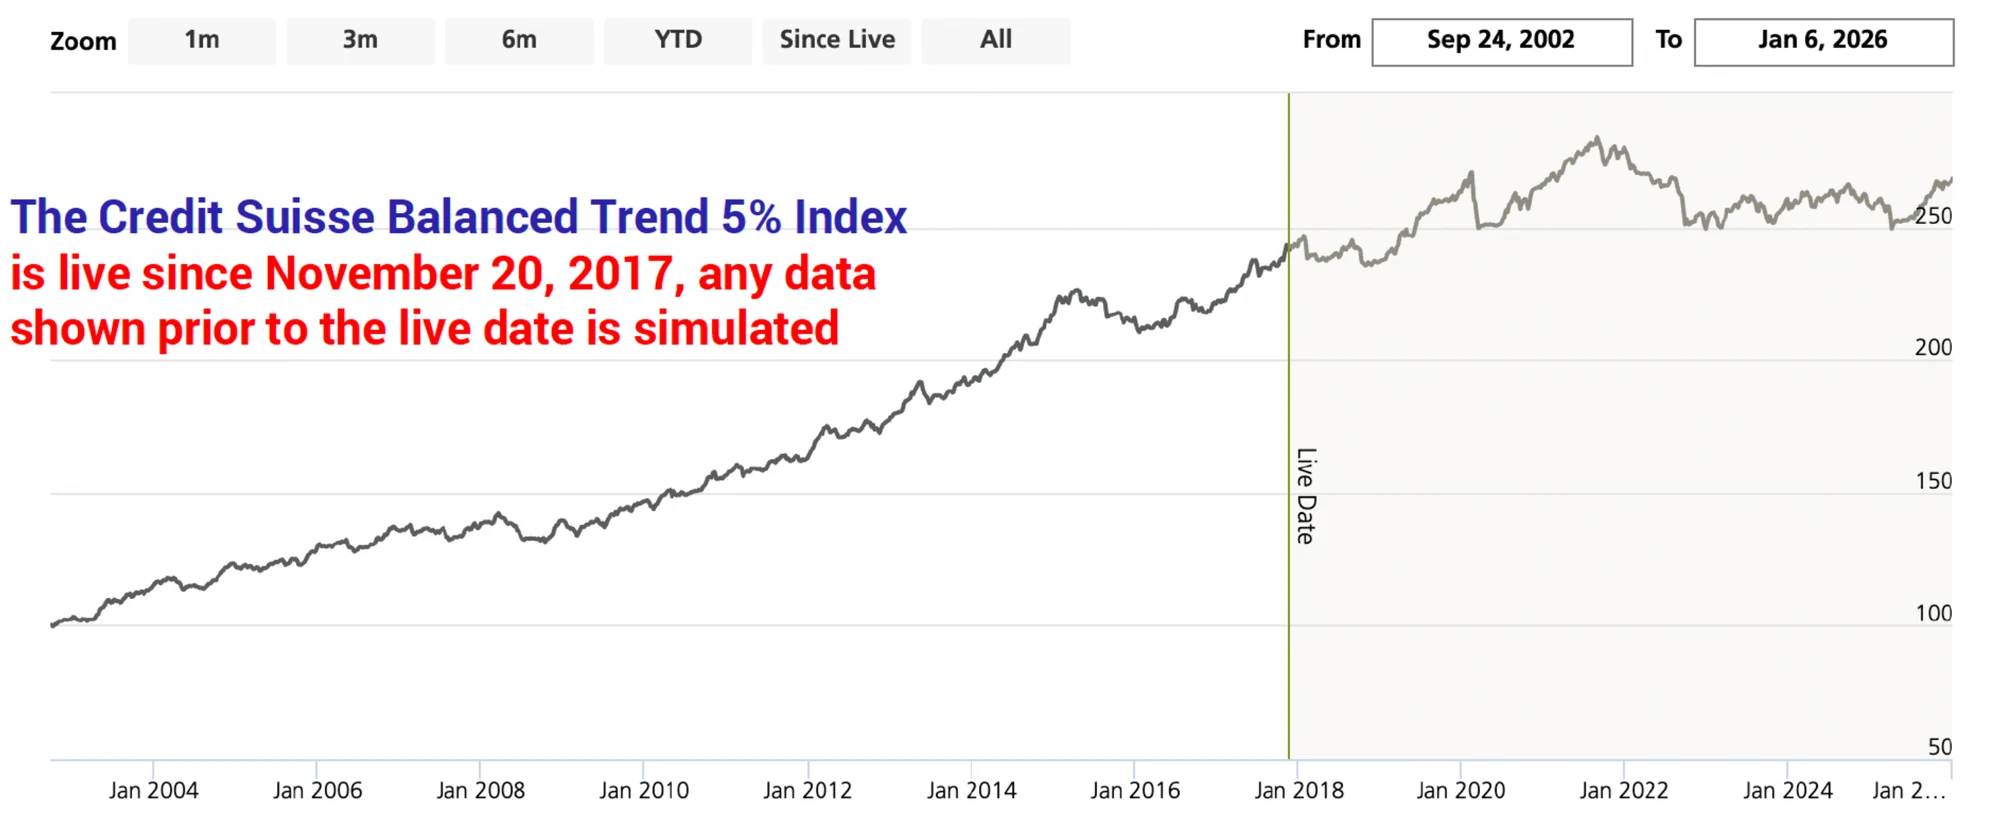
Credit Suisse(UBS)Balanced Trend 5% 指数走势,2002 年 9 月至 2026 年 1 月:2017 年 11 月 20 日推出日(Live Date 竖线)之前为模拟数据,从 100 一路涨到约 245;推出后到 2021 年底升到约 280,之后回落,2026 年初约 265 / The Credit Suisse (UBS) Balanced Trend 5% Index, September 2002 to January 2026: simulated before the 20 November 2017 live date (vertical line), rising from 100 to about 245; after launch it reaches about 280 by late 2021, then falls back to about 265 by early 2026
正式推出Live since2017 年 11 月 20 日20 Nov 2017
标普 500 · 2021/12–2026/1S&P 500 · Dec 2021–Jan 2026+47.4%
Balanced Trend · 2021/12–2026/1Balanced Trend · Dec 2021–Jan 2026+0.97%

第二个波动率控制指数,Balanced Trend,跟的是全球市场。原稿这里是两页,我们合成一页。

The second volatility-controlled index, Balanced Trend, follows global markets. The original used two pages; here they're one.

先看上面这张图里的竖线:Balanced Trend 是 2017 年 11 月 20 日正式推出的, 竖线左边同样是模拟数据。模拟的那一段,又是一条很漂亮、几乎一路向上的线。

First, the vertical line on the chart: Balanced Trend went live on 20 November 2017, and again everything to the left is simulated. That simulated stretch, again, is a beautiful, almost straight climb.

推出以后,它到 2021 年底还涨了一段,然后就回落、走平。我们取和 US Pacesetter 同样的时间窗口, 2021 年 12 月到 2026 年 1 月:标普 500 涨了 47.4%,Balanced Trend 只涨了 0.97%,四年几乎原地不动。

After launch it rose for a while until late 2021, then fell back and went flat. Over the same window as US Pacesetter, December 2021 to January 2026, the S&P 500 gained 47.4% while Balanced Trend gained just 0.97%, essentially standing still for four years.

两个波动率控制指数,两个不同的市场,结论一样:实盘期间大幅跑输标普。 它们存在的真实理由是对冲成本低,保险公司给得起高参与率;高参与率不是白给的,换来的是一个波动更低、涨得也更少的标的。

Two volatility-controlled indexes, two different markets, one conclusion: in live trading they lagged the S&P badly. Their real reason to exist is that they're cheap to hedge, so the carrier can offer a high participation rate. That rate isn't free; it's bought with an underlying that moves less and rises less.

讲师提醒Presenter note

波动率控制指数不是「不能选」,有的客户就是想要更平稳的记息。我们要做的是把实盘数据摆出来, 让客户在知道这些之后自己决定。

Volatility-controlled indexes aren't off-limits; some clients genuinely want steadier crediting. Our job is to put the live data on the table and let the client decide knowing it.

一张对账单:标普 vs 波动率控制指数One Statement: S&P vs Volatility Control

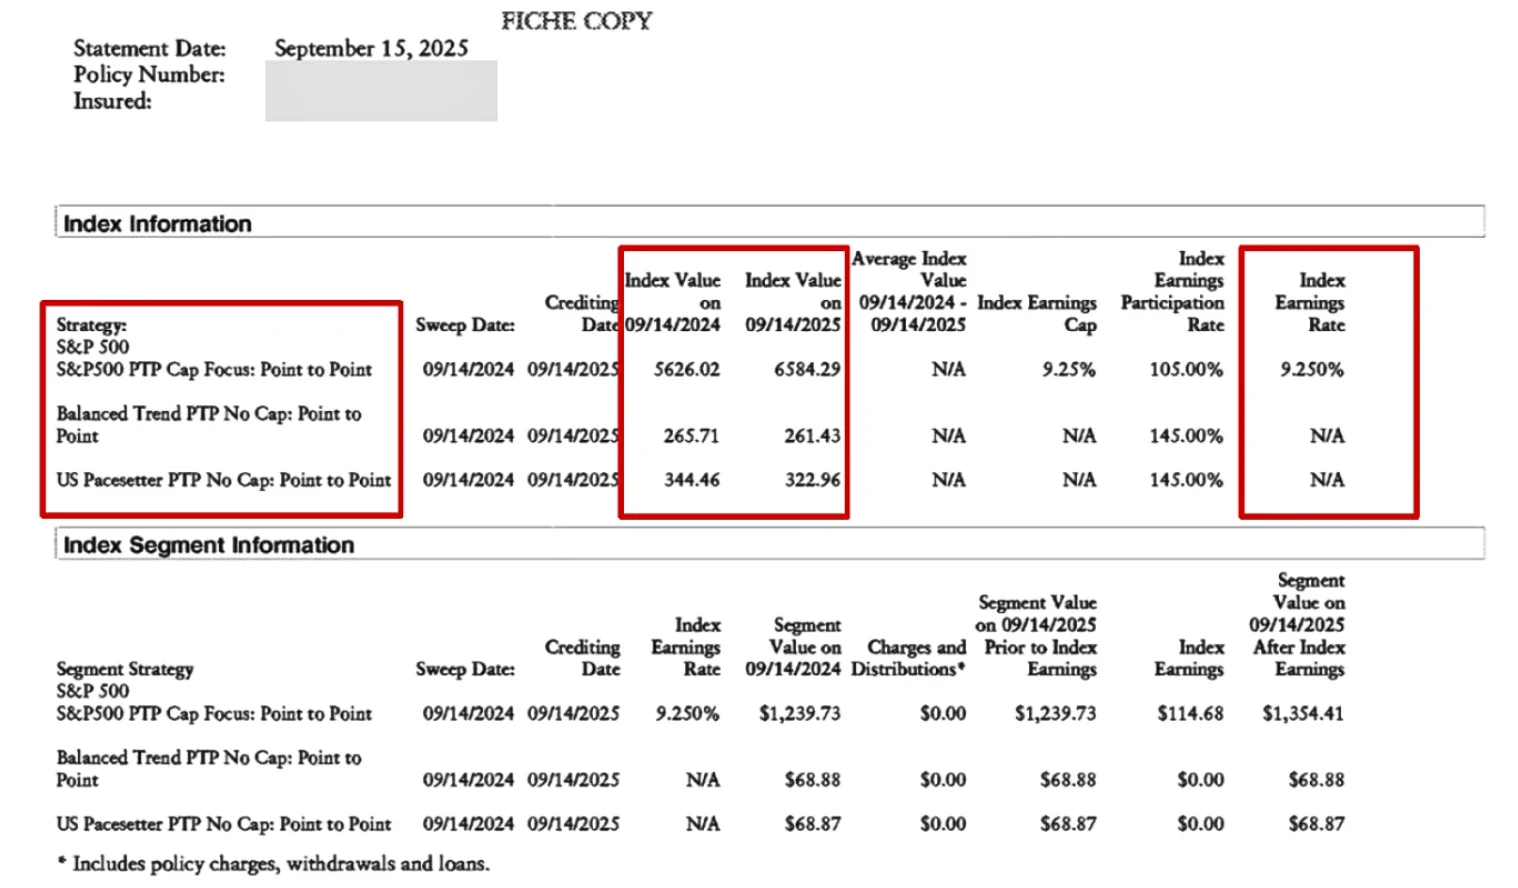
一张国家人寿保单的年度对账单(2025 年 9 月 15 日),保单号与被保险人已隐去:2024/9/14–2025/9/14,S&P500 PTP Cap Focus 指数 5626.02 → 6584.29,封顶 9.25%、参与率 105%,记息 9.250%,分段 $1,239.73 记息 $114.68;Balanced Trend PTP No Cap 265.71 → 261.43,US Pacesetter PTP No Cap 344.46 → 322.96,参与率都是 145%,记息 N/A、$0 / A National Life annual statement dated 15 September 2025, policy number and insured removed: for 9/14/2024–9/14/2025, S&P500 PTP Cap Focus went 5626.02 → 6584.29 with a 9.25% cap and 105% participation, earning 9.250%, $114.68 on a $1,239.73 segment; Balanced Trend PTP No Cap went 265.71 → 261.43 and US Pacesetter PTP No Cap 344.46 → 322.96, both at 145% participation, earning N/A, $0
一张国家人寿保单的年度对账单(2025 年 9 月)· 保单号与被保险人已隐去A National Life annual statement (September 2025) · policy number and insured removed

前面看的是指数走势图,这一页看一张真实的保单对账单,2025 年 9 月出的,同一张保单里三个策略各放了一点钱。

So far we've looked at index charts. This slide is a real policy statement from September 2025, with money in three strategies within the same policy.

这一年是 2024 年 9 月 14 日到 2025 年 9 月 14 日。标普 500 从 5,626.02 涨到 6,584.29,涨了 17.03%。 Cap Focus 这张保单的封顶是 9.25%、参与率 105%,17.03% 乘 105% 超过了封顶,所以记 9.25%。

The year runs from 14 September 2024 to 14 September 2025. The S&P 500 rose from 5,626.02 to 6,584.29, up 17.03%. On this policy Cap Focus has a 9.25% cap and 105% participation; 17.03% times 105% is above the cap, so it credits 9.25%.

同一年,Balanced Trend 从 265.71 跌到 261.43,跌了 1.61%;US Pacesetter 从 344.46 跌到 322.96,跌了 6.24%。 两个的参与率都是 145%,比标普高很多,但指数是跌的,两个都记 0。

In the same year Balanced Trend fell from 265.71 to 261.43, down 1.61%, and US Pacesetter from 344.46 to 322.96, down 6.24%. Both have 145% participation, far above the S&P strategy, but the indexes fell, so both credited 0.

落到钱上:标普那一段 $1,239.73,记了 $114.68 的利息;两个波动率控制指数各 $68 多,记 $0。 这一年标普涨了 17%,这两个指数却是跌的。参与率 145% 乘以负数,还是零。

In dollars: the S&P segment of $1,239.73 earned $114.68; the two volatility-controlled segments of about $68 each earned $0. In a year the S&P rose 17%, these two indexes fell. 145% participation times a negative is still zero.

指数走势图、实盘四年、一张真实对账单,三个角度,结论是一致的。

Index charts, four live years, one real statement: three angles, the same conclusion.

一张 10 年保单的记息Ten Years of Credits on One Policy

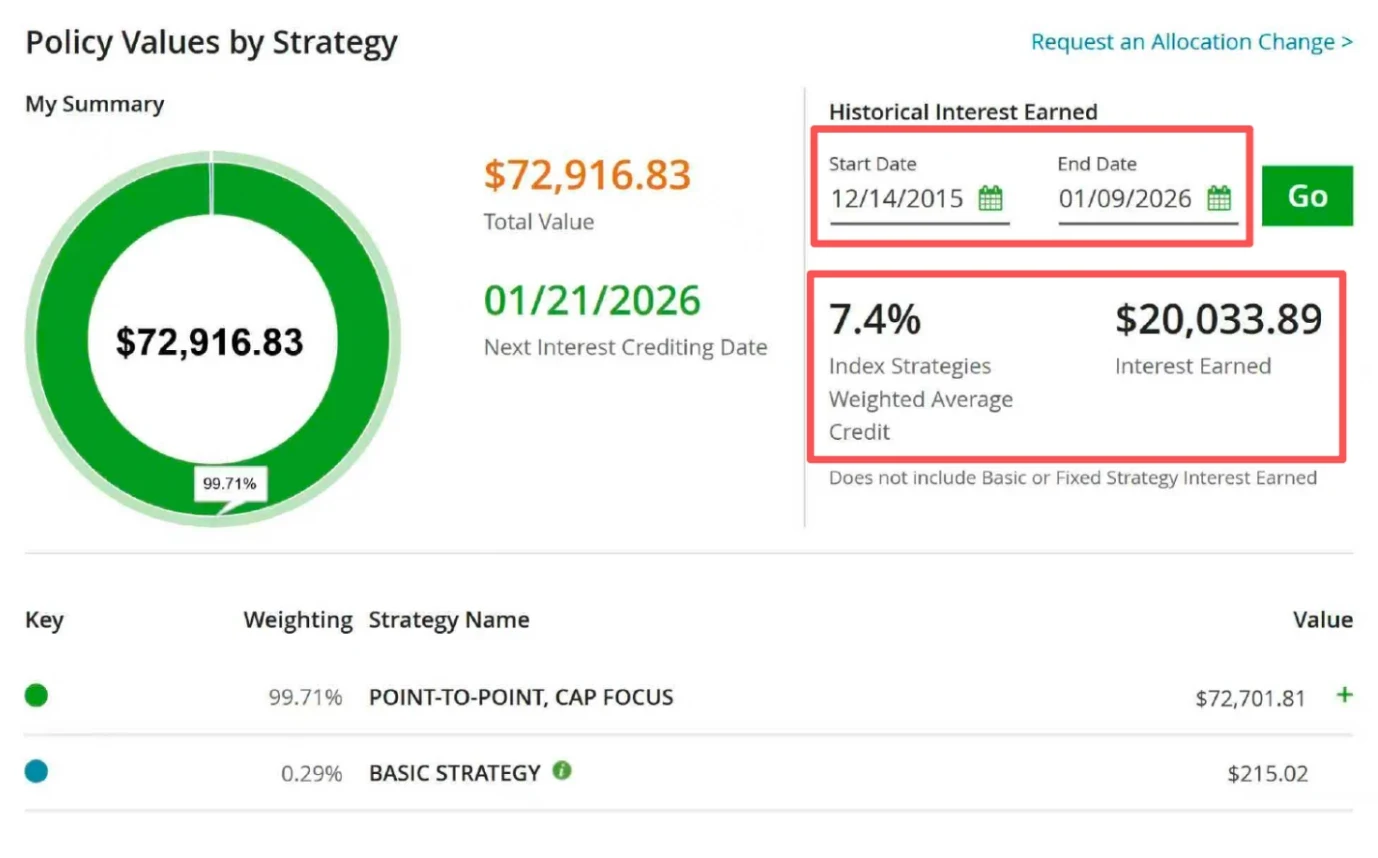
一张国家人寿保单的网上账户「Policy Values by Strategy」:总价值 $72,916.83,99.71% 在 Point-to-Point Cap Focus($72,701.81)、0.29% 在 Basic Strategy($215.02);2015/12/14 至 2026/1/9 指数策略加权平均记息 7.4%,累计记息 $20,033.89 / A National Life policy's online account, Policy Values by Strategy: total value $72,916.83, 99.71% in Point-to-Point Cap Focus ($72,701.81) and 0.29% in Basic Strategy ($215.02); from 12/14/2015 to 01/09/2026 the index strategies' weighted average credit was 7.4%, with $20,033.89 of interest earned

讲了这么多指数和回看,这一页看一张真实保单十年的记息情况。这是网上账户的截图。

After all the indexes and look-backs, here are ten years of credits on a real policy. This is a screenshot of the online account.

这张保单从 2015 年 12 月到 2026 年 1 月,十年多一点。钱几乎全部,99.71%,放在 S&P 500 Cap Focus。 这十年指数策略的加权平均记息是 7.4%,累计记了 $20,033.89 的利息,现在账户价值是 $72,916.83。

This policy runs from December 2015 to January 2026, just over ten years. Nearly all the money, 99.71%, sits in S&P 500 Cap Focus. Over the period the weighted average index credit was 7.4%, with $20,033.89 of interest credited in total and a current value of $72,916.83.

这个 7.4% 和前面 20 年回看里 Cap Focus 的数字差不多在同一个区间,可以拿来说明回看不是凭空的。 但一定要讲清楚它是什么:这是指数策略的记息率,不是账户的净回报。账户每个月还要扣保险成本和费用, 所以账户实际增长比 7.4% 低。

That 7.4% sits in roughly the same range as Cap Focus in the twenty-year look-back, which helps show the look-back isn't made up. But be precise about what it is: the index strategy's credit rate, not the account's net return. The account still pays insurance costs and charges every month, so its actual growth is below 7.4%.

增加利息条款:费用、加成、上限Interest-Boosting Riders: Charge, Bonus, Ceiling

档位Tier 费用Charge 利息加成比例Bonus rate 加成上限Bonus cap 记 1% 时变成1% credit becomes 11% 封顶变成11% cap becomes
Enhancer无None15%0.85%1.15%11.85%
Enhancer Plus1%45%2.50%1.45%13.50%
Max加成第 2–20 年bonus years 2–203%第 1–19 年years 1–1995%6.00%1.95%17.00%
Max加成第 21–30 年bonus years 21–302%第 20–29 年years 20–2970%4.25%1.70%15.25%
Max加成第 31 年起bonus year 31+1%第 30 年起year 30+45%2.50%1.45%13.50%

投保时二选一:Enhancer 系列,或不收费的利息奖金(第 2–9 年 0.25%,第 10 年起多数策略 0.50%,Basic、Fixed 策略 0.25%)Chosen at issue, one or the other: the Enhancer family, or the free Interest Bonus (0.25% in years 2–9; 0.50% from year 10 on most strategies, 0.25% on Basic and Fixed)

标普 500 点对点策略 · 当前值,非保证S&P 500 point-to-point · current values, not guaranteed

前面讲的都是指数本身,这一部分讲保单里增加利息的条款。国家人寿的 IUL 有两种做法: 一种是 Enhancer 系列,付一笔费用,换更高的加成上限;另一种是不收费的利息奖金。这一页先把 Enhancer 三个档位的参数放进一张表, 用两个例子来读。

So far we've talked about the indexes themselves. This part covers the policy's interest-boosting riders. National Life's IULs offer two approaches: the Enhancer family, which charges a fee for a higher bonus ceiling, and a free interest bonus. This slide puts the three Enhancer tiers' parameters in one table and reads them through two examples.

第一个例子,当年指数只记了 1%。Enhancer 变成 1.15%,Plus 变成 1.45%, Max 前二十年变成 1.95%。这就是「加成比例」的意思:1% 乘以 1.15、1.45、1.95。 但是别忘了左边那一列费用:Plus 每年 1%,Max 前十九年 3%。指数只记 1% 的年份,Plus 加成 0.45%、费用 1%, Max 加成 0.95%、费用 3%,都是付出去的比拿回来的多。

Example one: the index credits just 1%. Enhancer turns it into 1.15%, Plus into 1.45%, Max in its first twenty years into 1.95%. That is all the bonus rate means: 1% times 1.15, 1.45 or 1.95. But don't forget the charge column on the left: 1% a year for Plus, 3% for Max in years 1 to 19. In a 1% year Plus adds 0.45% and charges 1%; Max adds 0.95% and charges 3%. Both pay out more than they bring in.

第二个例子,指数涨得多,碰到了 11% 的封顶。这时候加成会被它的上限卡住: Enhancer 最多加 0.85%,变成 11.85%;Plus 最多加 2.5%,变成 13.5%;Max 前二十年最多加 6%,变成 17%, 第 21 到 30 年 15.25%,第 31 年起 13.5%。大家常说的「最高 17%」就是从这里来的:11% 封顶加 6% 的加成上限, 而且只在 Max 的第 2 到 20 年才有。

Example two: a strong year that hits the 11% cap. Now the bonus is limited by its own ceiling: Enhancer adds at most 0.85% for 11.85%; Plus at most 2.5% for 13.5%; Max at most 6% for 17% in years 2 to 20, then 15.25% in years 21 to 30 and 13.5% from year 31. That's where the familiar "up to 17%" comes from: an 11% cap plus a 6% bonus ceiling, and only in Max's years 2 to 20.

表下面还有一行要讲:LLD 投保时要在两种结构里二选一,之后不能在两类之间换。 一种是 Enhancer 系列;另一种是不收费的「利息奖金」,第 2 到 9 年加 0.25%,第 10 年起多数指数策略加 0.50%, Basic 和 Fixed 两个策略仍是 0.25%。后面两页回测表里那一列「利息奖金」,指的就是这个选项。

One more line under the table matters: at issue, LLD takes one of two structures, with no switching between them later. One is the Enhancer family; the other is the free Interest Bonus, which adds 0.25% in years 2 to 9 and 0.50% from year 10 on most index strategies, staying at 0.25% on the Basic and Fixed strategies. The "Interest Bonus" column in the next two back-test tables means this option.

最后再提醒一次:表里的加成比例和上限都是当前值,公司可以下调到保证值;费用不会跟着降。

A final reminder: the bonus rates and caps in this table are current values that the carrier can lower to the guaranteed level; the charges don't come down with them.

讲师提醒Presenter note

原始资料里 Max 的费用年份(1–19、20–29、30+)和加成年份(2–20、21–30、31+)是两组, 讲的时候分开说,不要合成「第 1–19 年 95%」。

In the source material Max's charge years (1–19, 20–29, 30+) and bonus years (2–20, 21–30, 31+) are two different sets. Keep them apart; don't merge them into "95% in years 1–19."

回测①:2005–2024 每年记息Back-test ①: Annual Crediting, 2005–2024

年份Year标普S&P利息奖金Int. bonusEnh.PlusMax
20053.00%3.40%3.45%4.31%5.67%
200613.62%11.25%11.85%13.50%17.00%
20073.53%3.96%4.06%5.07%6.68%
2008−38.49%0.25%0.00%−1.00%−3.00%
200923.45%11.25%11.85%13.50%17.00%
201012.78%11.25%11.85%13.50%17.00%
20110.00%0.25%0.00%−1.00%−3.00%
201213.41%11.25%11.85%13.50%17.00%
201329.60%11.25%11.85%13.50%17.00%
201411.39%11.25%11.85%13.50%17.00%
年份Year标普S&P利息奖金Int. bonusEnh.PlusMax
2015−0.73%0.50%0.00%−1.00%−3.00%
20169.54%10.52%10.97%13.50%17.00%
201719.42%11.50%11.85%13.50%17.00%
2018−6.24%0.50%0.00%−1.00%−3.00%
201928.88%11.50%11.85%13.50%17.00%
202016.26%11.50%11.85%13.50%17.00%
202126.89%11.50%11.85%13.50%17.00%
2022−19.44%0.50%0.00%−1.00%−3.00%
202324.23%11.50%11.85%13.50%17.00%
202423.31%11.50%11.85%13.50%17.00%
标普S&P利息奖金Int. bonusEnh.PlusMax
近 10 年几何平均10-yr geometric avg.11.07%7.98%8.07%8.94%未扣费before charge10.60%未扣费before charge
20 年几何平均20-yr geometric avg.8.22%7.71%7.91%8.80%扣费后约 7.99%≈7.99% after charge10.56%扣费后约 8.07%≈8.07% after charge
波动率Volatility17.07%4.97%5.35%6.49%8.87%

回测非保证 · 现在的参数套历史标普价格涨幅(不含分红) · Plus、Max 在涨的年份未扣附约费用Back-test, not guaranteed · today's parameters on historical S&P price returns (no dividends) · Plus and Max shown before the rider charge in up years

这一页是回测。先说清楚它是什么:把现在的产品参数,套到 2005 到 2024 年标普 500 每一年的实际涨跌上, 看每一种选择那一年会记多少。它不是哪一张真实保单的历史,也不代表以后。

This is a back-test. First, what it is: today's product parameters applied to the S&P 500's actual moves in each year from 2005 to 2024, to see what each option would have credited. It isn't the history of any real policy, and it says nothing certain about the future.

先看标亮的五年:2008、2011、2015、2018、2022。这些年标普是跌的或者持平,2008 年跌了 38.49%。 同一年,「利息奖金」那一列还记了 0.25% 或 0.50%;Enhancer 记 0;而 Plus 和 Max 是负 1% 和负 3%。 为什么开了 Enhancer 反而是负的?因为指数记 0,加成也是 0,但附约费用照扣。 这就是我们前面说的:0 的年份不是没有代价。

Start with the five highlighted years: 2008, 2011, 2015, 2018 and 2022, when the S&P fell or went nowhere; in 2008 it lost 38.49%. In those years the Interest Bonus column still credited 0.25% or 0.50%, Enhancer credited zero, and Plus and Max show −1% and −3%. Why negative with an Enhancer? Because a zero credit means a zero bonus, while the rider charge still comes out. That's the point we made earlier: a zero year isn't free.

再看涨的年份。2013 年标普涨了 29.6%,IUL 各列都被上限卡住:Enhancer 11.85%,Plus 13.5%,Max 17%。 这就是 IUL 的交换:跌的时候指数部分不记负数,涨的时候也拿不全。

Now the up years. In 2013 the S&P rose 29.6%, and every IUL column hit its ceiling: 11.85% for Enhancer, 13.5% for Plus, 17% for Max. That's the IUL trade: the index side never goes negative in a down year, and you don't get all of a strong year either.

最下面三行最要小心读。20 年几何平均,标普 8.22%,Enhancer 7.91%。 Plus 和 Max 写着 8.80% 和 10.56%,但这两个数在涨的年份没有扣附约费用;扣掉以后,按下一页的累计金额算, 20 年大约是 7.99% 和 8.07%。波动率那一行倒是很清楚:标普 17%,IUL 各列在 5% 到 9% 之间, 起伏小得多。

Read the bottom three rows carefully. Over 20 years the geometric average is 8.22% for the S&P and 7.91% for Enhancer. Plus and Max show 8.80% and 10.56%, but those figures leave out the rider charge in up years; take it out, using the cumulative values on the next slide, and the 20-year figures are about 7.99% and 8.07%. The volatility row is clear enough: 17% for the S&P, between 5% and 9% for the IUL columns, a much smoother ride.

合规提醒Compliance

这是回测,不是保证,也不是回报率。不要把 10.56% 这类数字单独截出来发给客户; 要讲,就把「未扣费用」「用现在的参数回算」一起讲。上限和加成比例以后可能下调。

This is a back-test, not a guarantee and not a rate of return. Don't clip a figure like 10.56% and send it to a client; if you use it, say "before charges" and "today's parameters applied backwards" in the same breath. Caps and bonus rates may be lowered in future.

回测②:2004 年存 $10 万,到 2024 年Back-test ②: $100,000 from 2004 to 2024

年份Year标普S&P利息奖金Int. bonusEnh.PlusMax
2004$100,000$100,000$100,000$100,000$100,000
2005$103,000$103,400$103,450$103,263$102,504
2006$117,029$115,033$115,709$116,032$116,332
2007$121,160$119,584$120,406$120,693$120,377
2008$74,525$119,883$120,406$119,486$116,765
2009$92,002$133,370$134,674$134,260$132,517
2010$103,759$148,374$150,633$150,861$150,393
2011$103,759$148,745$150,633$149,353$145,882
2012$117,673$165,478$168,483$167,820$165,561
2013$152,505$184,095$188,448$188,571$187,895
2014$169,875$204,805$210,779$211,888$213,242
年份Year标普S&P利息奖金Int. bonusEnh.PlusMax
2015$168,635$205,829$210,779$209,769$206,845
2016$184,723$227,476$233,904$235,707$234,748
2017$220,596$253,636$261,622$264,852$266,416
2018$206,831$254,904$261,622$262,204$258,424
2019$266,563$284,218$292,624$294,625$293,285
2020$309,907$316,903$327,300$331,055$332,849
2021$393,241$353,347$366,085$371,990$377,750
2022$316,795$355,114$366,085$368,271$366,418
2023$393,554$395,952$409,466$413,807$415,848
2024$485,291$441,487$457,987$464,974$471,946
年化Annual.8.22%7.71%7.91%7.99%8.07%

回测,非保证 · 用现在的参数回算历史,不是当年真实存在的保单
IUL 各列扣了附约费用,没扣保险成本与保单费用 · 标普为价格涨幅,不含分红、不扣基金费用
Back-test, not guaranteed · today's parameters applied to history, not a policy that existed then
IUL columns net of rider charges but not of insurance and policy costs · S&P is price return, no dividends, no fund fees

上一页是每年记多少,这一页把它累计起来:假设 2004 年放进去 $10 万,每一列滚到 2024 年是多少。 IUL 这几列已经扣了附约费用,所以 Plus 和 Max 是扣费后的结果。

The last slide showed each year's crediting; this one accumulates it. Put $100,000 in at 2004 and roll each column forward to 2024. The IUL columns are net of the rider charges, so Plus and Max here are after their fees.

先看 2008 年这一行。标普从 $121,160 掉到 $74,525,一年少了将近四成; IUL 各列基本不动,Enhancer 停在 $120,406,Max 因为扣了 3% 费用,从 $120,377 降到 $116,765。 到 2011 年,标普才回到 $10 万出头,IUL 各列已经在 $14.6 万到 $15.1 万之间。 这就是 IUL 最好讲的地方:大跌那几年,指数部分不跟着跌。

Start with 2008. The S&P drops from $121,160 to $74,525, losing almost 40% in a year. The IUL columns barely move: Enhancer stays at $120,406, and Max slips from $120,377 to $116,765 because of its 3% charge. By 2011 the S&P is only just back above $100,000, while the IUL columns sit between $146,000 and $151,000. This is the easiest part of the IUL story to tell: in the crash years the index side doesn't fall with the market.

再看 2024 年这一行,要诚实地读。二十年下来,标普是 $485,291,年化 8.22%; IUL 最高的 Max 是 $471,946,年化约 8.07%;Enhancer $457,987,利息奖金 $441,487。 也就是说,在这二十年里,标普最后的数字比 IUL 各列都高,IUL 换来的是一路上起伏小得多。 讲给客户听的是这个交换,不是「比标普还高」。

Then read 2024 honestly. After twenty years the S&P is at $485,291, 8.22% a year; the best IUL column, Max, is at $471,946, about 8.07%; Enhancer $457,987; the Interest Bonus $441,487. Over these twenty years, the S&P ends above every IUL column; what the IUL buys is a far smoother path. That trade is what to explain to a client, not "it beats the S&P."

还有两条口径一定要说。第一,这几列 IUL 只扣了附约费用,没扣保险成本和保单费用, 真实保单的现金值会比这里低,前几年低得更多。第二,标普这一列是价格涨幅,不含分红,也没扣基金费用。 两边都不是真实账户,只是帮助理解机制。

Two caveats must go with it. First, the IUL columns deduct only the rider charges, not the cost of insurance or policy expenses, so a real policy's cash value would be lower, especially in the early years. Second, the S&P column is price return, with no dividends and no fund fees. Neither side is a real account; both are there to explain the mechanics.

讲师提醒Presenter note

这张表的标普一列按上一页的每年涨幅重新算过:原稿 2007 年和 2010 年两格接错了, 导致之后每年都偏低,2024 年写成 $467,718;按上一页 8.22% 的 20 年平均,应为 $485,291。

The S&P column has been recalculated from the previous slide's annual returns: the original sheet broke at 2007 and 2010, which understated every later year and showed $467,718 for 2024. At the previous slide's 8.22% twenty-year average it comes to $485,291.

一张保单的两年对账单Two Years of Statements on One Policy

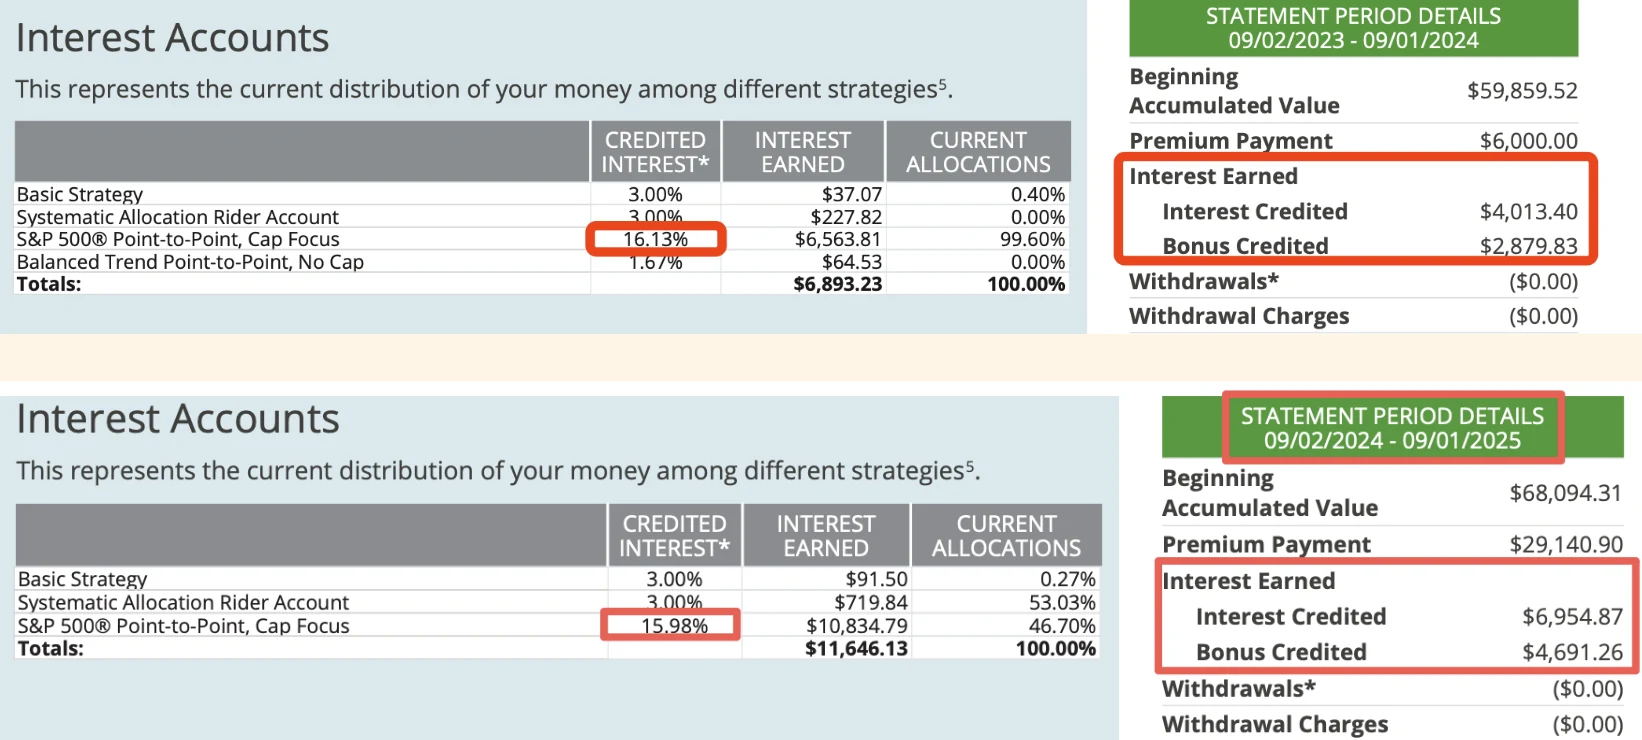
同一张保单两年的年度对账单:2023/9/2–2024/9/1 期初 $59,859.52,保费 $6,000,S&P 500 Cap Focus 记息率 16.13%,记息 $4,013.40、奖金 $2,879.83;2024/9/2–2025/9/1 期初 $68,094.31,保费 $29,140.90,Cap Focus 记息率 15.98%,记息 $6,954.87、奖金 $4,691.26,53.03% 在 Systematic Allocation Rider Account / Two annual statements on one policy: 9/2/2023–9/1/2024, beginning value $59,859.52, premium $6,000, S&P 500 Cap Focus credited 16.13%, interest $4,013.40 and bonus $2,879.83; 9/2/2024–9/1/2025, beginning value $68,094.31, premium $29,140.90, Cap Focus credited 15.98%, interest $6,954.87 and bonus $4,691.26, with 53.03% in the Systematic Allocation Rider Account

最后一张对账单,看开了 Enhancer 以后,好年份会是什么样子。同样是真实保单的对账单截图。

One last statement, showing what a good year looks like with an Enhancer. Again a real policy's statement screenshots.

2023 年 9 月到 2024 年 9 月这一年,期初账户价值 $59,859.52,存了 $6,000 保费,Cap Focus 的记息率是 16.13%:记息 $4,013.40,奖金 $2,879.83。下一年,2024 年 9 月到 2025 年 9 月,期初 $68,094.31, 存了 $29,140.90,Cap Focus 记息率 15.98%:记息 $6,954.87,奖金 $4,691.26。

From September 2023 to September 2024, the account started at $59,859.52, took $6,000 of premium, and Cap Focus credited 16.13%: $4,013.40 of interest plus a $2,879.83 bonus. The next year, September 2024 to September 2025, it started at $68,094.31, took $29,140.90, and Cap Focus credited 15.98%: $6,954.87 of interest plus a $4,691.26 bonus.

16% 怎么来的?基础封顶 11%,再加 Enhancer 的加成,最多加 6%,到 17%。这两年标普都涨得多,所以接近顶格。 这就是前面那张参数表里「最高 17%」的真实样子。

Where does 16% come from? The 11% base cap plus the Enhancer bonus, up to 6% more, for a ceiling of 17%. The S&P rose strongly in both years, so the credit came close to the top. This is what "up to 17%" from the parameter table looks like in practice.

但有三件事要一起讲。第一,这两年标普都是大涨,换成平年或跌年,记息会低很多甚至是 0, 前面回测表里 2008、2022 这样的年份,Max 是负 3%。第二,对账单上的记息率还没扣附约费用和保险成本。 第三,第二年那 $29,140.90 新保费大部分先放在 Systematic Allocation 账户按 3% 记息,再分批转进指数策略, 所以那一年 Cap Focus 只占账户的一半左右。

Three things go with it. First, both years were big S&P years; in a flat or down year the credit would be far lower, even zero, and in years like 2008 and 2022 in the back-test, Max was −3%. Second, the statement rate doesn't yet deduct rider charges or insurance costs. Third, most of the $29,140.90 paid in year two sat in the Systematic Allocation account at 3% before moving into the index strategy in stages, so Cap Focus held only about half the account that year.

IUL 保单断保吗?先看保证栏Can an IUL Lapse? Start with the Guaranteed Column

Living Life Defender 计划书的保证栏 Guaranteed Illustrated Values:保证值按 0.10% 利率计算,Enhancer 不计入;累计保费 $120,000,第 33 年(32 岁)账户价值 $46,296,第 40 年 $26,430,第 45 年 $8,629,第 47 年 $992,第 48 年(47 岁)失效 Lapse,身故保额 $1,000,000 / The Guaranteed Illustrated Values ledger of a Living Life Defender illustration: guaranteed values use a 0.10% rate and exclude the Enhancer; $120,000 of premium in all; account value $46,296 in year 33 (age 32), $26,430 in year 40, $8,629 in year 45, $992 in year 47, lapsing in year 48 (age 47); death benefit $1,000,000
Living Life Defender 计划书「Guaranteed Illustrated Values」· 从小投保、$100 万保额A Living Life Defender illustration's Guaranteed Illustrated Values · issued in childhood, $1M face

最后一部分,回答客户一定会问的问题:IUL 保单会不会断保?答案是:会,在一定条件下。 我们先看计划书里专门回答这个问题的那一栏,保证栏。

The last part answers the question every client asks: can an IUL lapse? The answer is yes, under certain conditions. Start with the column of the illustration built to answer exactly that: the guaranteed column.

这是一份 Living Life Defender 计划书的「Guaranteed Illustrated Values」,从小投保,$100 万保额,一共存了 $120,000。 保证栏的假设是最坏的:每年只记 0.10% 的利息,费用全部按合同允许的上限扣,Enhancer 不算进去。

This is the Guaranteed Illustrated Values page of a Living Life Defender illustration: issued in childhood, $1 million face, $120,000 of premium in all. The guaranteed column assumes the worst: only 0.10% credited every year and every charge at the contractual maximum, with no Enhancer.

在这个假设下,账户价值第 33 年还有 $46,296,之后每年往下掉:第 40 年 $26,430,第 45 年 $8,629,第 47 年只剩 $992, 第 48 年失效。所以说 IUL 会不会断保?只按保证值算,是会的。

On those assumptions the account still holds $46,296 in year 33, then falls every year: $26,430 in year 40, $8,629 in year 45, $992 in year 47, and it lapses in year 48. So can an IUL lapse? On guaranteed values alone, yes.

但这一栏要怎么理解?它的意思是:如果几十年里每年都几乎没有利息,费用又一直按最高的扣, 这张保单会在 47 岁那年失效。现实里要走到这一步,需要两件事同时发生,下一页讲。

How should the column be read? It says: if for decades there's almost no interest every year and charges always run at their maximum, this policy lapses at age 47. In real life getting there takes two things happening at once, which the next slide covers.

合规提醒Compliance note

保证栏一定要指给客户看,不能只讲当前假设那一栏。客户签字确认的计划书里,两栏都在。

Always point the client to the guaranteed column, not just the current-assumption one. Both are in the illustration the client signs.

IUL 保单断保吗?两个条件同时发生Can an IUL Lapse? Two Things at Once

手绘示意图:左边理财账户,保费和利息流入,成本费用流向右边保险账户;右边保险账户有身故福利 $1,000,000 和五类生前福利 / Hand-drawn diagram: premiums and interest flow into the cash value account on the left; costs and charges flow to the insurance account on the right, which holds a $1,000,000 death benefit and five living benefits
1保费没按计划存够Premium not funded as planned
2利息连续多年是 0Interest at 0 for several years running

这张手绘图大家在《IUL 是怎么运作的》那一篇已经见过。左边是理财账户,保费和利息流进来; 中间那个箭头是成本和费用,每个月从理财账户流到右边的保险账户,用来支撑 $100 万的身故福利和五类生前福利。

You've seen this hand-drawn picture in the How an IUL Works article. On the left is the cash value account, with premiums and interest flowing in. The arrow in the middle is costs and charges, flowing each month from the cash value account to the insurance account on the right, which carries the $1 million death benefit and five living benefits.

保单什么时候会断?就是左边的水位低到不够扣右边的成本。水位从哪里来?只有两个来源:保费和利息。 所以断保要两个条件同时发生:第一,保费没按计划存够;第二,利息连续多年是 0。

When does a policy lapse? When the level on the left falls too low to cover the costs on the right. Where does the level come from? Only two sources: premium and interest. So a lapse takes two things at once: one, premium wasn't funded as planned; two, the interest was zero for several years running.

只有一个条件,通常撑得住。保费按计划存够了,偶尔几年记 0,账户有足够的缓冲;利息年年都有,少存一两年, 也还能顶一阵。两个叠在一起,才会出事。上一页的保证栏,就是把这两件事推到了极端:存完 $12 万就不存了,几十年每年都只有 0.10%。

With only one of them, a policy usually holds. Funded as planned, an occasional zero year is absorbed by the cushion; with interest coming in every year, a year or two of missed premium can be carried for a while. It's the combination that breaks it. The last slide's guaranteed column pushes both to the extreme: $120,000 and then nothing, with only 0.10% a year for decades.

那「利息连续多年是 0」有多常见?最后一页看标普的历史。

So how common is "zero interest for several years running"? The final slide looks at the S&P's history.

讲师提醒Presenter note

第一个条件是我们和客户可以控制的:方案按保守的演示利率设计、保费按计划存、每年看对账单。 这也是为什么前面一直强调不要按最高演示利率压低保费。

The first condition is within our and the client's control: design at a conservative illustrated rate, fund as planned, and review the statement every year. That's why we kept stressing not to squeeze the premium down with the maximum illustrated rate.

标普 500 历史:连跌几年有多少见S&P 500 History: How Rare Are Back-to-Back Losses?

连续 3 年下跌:1957 年以来仅一次Three down years in a row: once since 1957
2000−10.14%
2001−13.04%
2002−23.37%
互联网泡沫The dot-com bust
连续 2 年下跌:1957 年以来仅一次Two down years in a row: once since 1957
1973−17.37%
1974−29.72%
石油危机The oil crisis

自 1957 年以来,平均年回报超过 10%Since 1957, the average annual return is above 10%

年涨幅为价格指数 · 平均超过 10% 是含分红的总回报 · IUL 记息不含分红Annual changes are price returns · "above 10%" is the total-return figure, with dividends; IUL crediting excludes them

最后一页,回到上一页的第二个条件:利息连续多年是 0。对标普策略来说,记 0 的年份就是标普下跌的年份。 那标普连续几年下跌,历史上有多常见?

The final slide returns to the second condition: zero interest for several years running. For an S&P strategy, a zero year is a year the S&P fell. So how often has it fallen several years in a row?

从 1957 年标普 500 推出算起:连续 3 年下跌,只发生过一次,就是 2000、2001、2002 年互联网泡沫, 分别跌了 10.14%、13.04%、23.37%。连续 2 年下跌,也只发生过一次,1973、1974 年石油危机, 跌了 17.37% 和 29.72%。除此之外,标普没有连续两年下跌过。

Counting from the S&P 500's launch in 1957: three down years in a row has happened once, in 2000, 2001 and 2002, the dot-com bust, at −10.14%, −13.04% and −23.37%. Two down years in a row has also happened only once, 1973 and 1974, the oil crisis, at −17.37% and −29.72%. Other than those, the S&P has never fallen two years running.

也就是说,「利息连续多年是 0」这件事,在近七十年的历史里非常少见。再加上第一个条件,保费按计划存够, 两个同时发生的概率就更低了。这就是我们回答「IUL 会不会断保」的完整逻辑:会,但需要两个条件同时发生, 而第一个条件掌握在我们自己手里。

In other words, "zero interest for several years running" has been very rare across nearly seventy years. Add the first condition, funding as planned, and the chance of both together is lower still. That's the full answer to "can an IUL lapse?": yes, but it takes two things at once, and the first is in our own hands.

最后说一下「自 1957 年以来平均回报超过 10%」这个数字。它是含分红的总回报口径, 而 IUL 记息只看价格指数,不含分红,还要封顶。所以不要拿 10% 去说明 IUL 能做到多少, 它只用来说明一件事:长期来看,标普下跌的年份少,连续下跌的年份更少。

One last word on "above 10% a year since 1957." That's a total-return figure including dividends, while IUL crediting uses the price index without dividends, and then caps it. So never use 10% to suggest what an IUL can earn. Use it for one thing only: over the long run, down years for the S&P are few, and back-to-back down years fewer still.

今天这一组就讲到这里,谢谢大家。

That's the end of this set. Thank you, everyone.

合规提醒Compliance note

历史表现不预示未来。不要说「标普不可能连跌三年」,也不要把 10% 和 IUL 的记息放在同一句话里。

Past performance doesn't predict the future. Don't say "the S&P can't fall three years running," and never put 10% and IUL crediting in the same sentence.

先说数字First, about the numbers

封顶、参与率、奖金区间、演示利率都是成稿时的数值,每年都会调整。 报给客户之前查当期产品说明书和计划书。

Caps, participation rates, bonus ranges, and illustrated rates are as of the time of writing. They are revised every year. Check the current product guide and illustration before quoting.

1. 指数是什么1. What an index is

一个指数就是衡量一篮子股票整体表现的一个数字。 标普 500、上证指数、恒生指数都是这么回事,只是篮子里装的东西不一样。

An index is one number that measures how a basket of stocks did as a whole. The S&P 500, the Shanghai Composite, and the Hang Seng are all the same idea with different baskets.

标普 500The S&P 500

按市值加权的 500 多家美国领先上市公司,苹果、微软、英伟达、谷歌、 亚马逊、特斯拉、沃尔玛这些都在里面。它是衡量美国整体股市表现最好的指标之一, 1957 年推出,是最常被引用的美股指数之一。

Market-cap weighted, made up of 500-plus leading US listed companies, with Apple, Microsoft, Nvidia, Alphabet, Amazon, Tesla, Walmart among them. It's one of the best single measures of the US market; launched in 1957, it's among the most quoted US indices.

成分是会变的,这一点值得跟客户讲。 指数不是一篮子固定的公司放在那儿不动:表现掉队的会被移出,新的领头羊会被加进来。 例如:Tesla 2020 年 12 月加入、Airbnb 与 Blackstone 2023 年 9 月加入、 DoorDash 2025 年 3 月加入;而 Yahoo 2017 年 6 月、Staples 2017 年 9 月、Macy's 2020 年 4 月、 Harley-Davidson 2020 年 6 月被移出。指数本身带有自我更新的机制。

The membership changes, and that's worth saying out loud. An index isn't a fixed set of companies left to drift. Laggards come out and new leaders go in. For example: Tesla joined in December 2020, Airbnb and Blackstone in September 2023, DoorDash in March 2025; Yahoo left in June 2017, Staples in September 2017, Macy's in April 2020 and Harley-Davidson in June 2020. The index refreshes itself.

2. IUL 的核心:跟涨不跟跌2. The core idea: up with the index, not down

下跌保底 Floor

The floor

指数跌的时候,当年利息可能是 0%,但不会是负数。 有句口号叫「零就是英雄 Zero is Hero」。

When the index falls, the year may credit 0%, but never a negative. The phrase for it: zero is hero.

上涨封顶 Cap

The cap

涨的时候有上限。保底不是白给的,封顶就是保底的价钱。 这句话一定要主动说,别等客户自己发现。

The upside is capped. The floor isn't free: the cap is what the floor costs. Say it first; don't let the client find it themselves.

为什么「不亏」这么值钱Why "not losing" is worth so much

因为亏损和收益不对称。$100,000 亏 50% 剩 $50,000, 要回到 $100,000 需要的不是 50% 而是 100% 的收益。

Because losses and gains are asymmetric. $100,000 down 50% is $50,000. Getting back to $100,000 takes not 50% but 100%.

年度重置 Annual ResetThe annual reset

每年的利息一旦结算就锁定。下跌的年份不需要"补回去", 这一年的年终价值直接成为下一年的起始价值。 所以 IUL 不存在"先把之前跌掉的补回来才开始赚"这件事,而股票账户有。

Once a year's interest is credited it is locked. A down year never has to be made up. This year's ending value simply becomes next year's starting value. There is no "dig out of the hole first" the way there is in a brokerage account.

1970 年代的真实数据可以演示:1970 年底各放 $100,000,一个跟着标普 500 涨跌,一个按封顶 9.25%、保底 0% 年度重置。 1973、1974 年石油危机标普连跌 17.37% 和 29.72%,标普账户从 $128,106 掉到 $74,394;年度重置账户停在 $119,356。 1975 年标普反弹 31.55%,标普账户只回到 $97,866,年度重置账户直接从 $119,356 往上记到 $130,396;1976 年两边是 $116,607 对 $142,458。 这段年份对年度重置特别有利,在 1995–1999 这种连续大涨的年份,有封顶的账户会明显落后。

The 1970s show it with real data. Put $100,000 into each of two accounts at the end of 1970: one follows the S&P 500, the other resets annually with a 9.25% cap and 0% floor. In the 1973–74 oil crisis the S&P fell 17.37% and then 29.72%, taking its account from $128,106 to $74,394; the reset account held at $119,356. In 1975 the S&P bounced 31.55%, yet its account only reached $97,866, while the reset account credited straight up from $119,356 to $130,396. By 1976 it stood at $116,607 versus $142,458. That stretch flatters the reset; in long strong runs such as 1995–1999, a capped account falls well behind.

3. 封顶与参与率3. Cap and participation rate

两个旋钮,决定同一个指数涨幅最后变成多少利息:

Two dials turn the same index move into different credited interest:

国家人寿的策略之间就是在这两个旋钮上做取舍: 有的封顶更高,有的参与率更高但封顶低, 还有的把保底从 0% 抬到 1%、代价是封顶更低。 结论是:封顶更高的标普 500 策略长期平均回报更高。 过去 20 年里标普 500 有 13 年涨幅超过 8.5%,高封顶才吃得到这些年份。 计划书的历史演示(现在的参数加 Enhancer 加成,套 2005–2024 年)20 年几何平均:Cap Focus 7.88%, Participation Focus 6.37%,1% Floor 6.68%;同期标普价格涨幅是 8.20%,比任何一个 IUL 策略都高。

National Life's strategies trade these two against each other: some carry a higher cap, some a higher participation rate with a lower cap, and one lifts the floor from 0% to 1% at the cost of a lower cap. The upshot: the higher-cap S&P 500 strategy has the better long-run average. In the last twenty years the index gained more than 8.5% in thirteen of them, and only a high cap captures those. A proposal's historical illustration (today's parameters plus the Enhancer bonus, applied to 2005–2024) gives twenty-year geometric averages of 7.88% for Cap Focus, 6.37% for Participation Focus and 6.68% for 1% Floor; the S&P's own price return over the same years was 8.20%, above every IUL strategy.

4. 演示利率:差一点,差很多4. The illustrated rate: a small gap that grows

计划书上那个"演示利率"受 AG49 规范约束,不是随便填的。 但它对结果的影响大到惊人。下面这个案例是反着看的。 同样 40 岁女性、$100 万身故保额,问的是要达到这个保额,每月得存多少:

The illustrated rate on a proposal is constrained by AG49, so it isn't a free choice. Its effect is still startling. The example below runs it backwards: same female age 40, same $1M death benefit, asking how much a month it takes to get there:

演示利率Illustrated rate所需月缴保费Monthly premium required
5%$885.95
6%$687.30
6.44%$622.26

正着看:同样存 $6 万/年存 4 年,演示利率越高,账户价值越高,而且时间越长差得越多。

Forwards: on the same $60,000 a year for four years, a higher rate means a higher account value, and the gap widens with time.

演示利率Illustrated rate65 岁账户价值Value at 6585 岁账户价值Value at 85
5%$650,272$1,841,138
6%$833,925(+28%)$833,925 (+28%)$2,866,887(+56%)$2,866,887 (+56%)
6.44%$928,619(+43%)$928,619 (+43%)$3,468,087(约 1.9 倍)$3,468,087 (about 1.9×)

各家公司的演示利率也不一样(成稿时):国家人寿标普 Cap Focus 6.81%,Symetra 标普 7.00%, F&G 标普 7.19%,Transamerica 7.70%。差不到一个百分点,计划书就能差出上面这么多。

Carriers illustrate at different rates too (as of writing): National Life S&P Cap Focus 6.81%, Symetra S&P 7.00%, F&G S&P 7.19%, Transamerica 7.70%. Less than a point apart, and the illustrations differ by as much as the tables above.

5% 到 6%,85 岁时多 56%;5% 到 6.44%,差 1.44 个百分点,接近翻倍。

From 5% to 6% adds 56% at age 85; from 5% to 6.44%, a 1.44-point step, comes close to doubling it.

所以两件事同时成立:① 演示利率高的方案在纸面上永远更好看; ② 纸面好看不等于将来真的做得到。 这正是《保单费用》里那六条"事先约定"的最后一条:预估表只是预估表。 拿演示利率去比两家公司的方案,是新人最常犯的错。

Two things are true at once: (1) a higher illustrated rate always looks better on paper, and (2) looking better on paper is not the same as happening. This is exactly the last of the six things to settle before an IUL sale: an illustration is an illustration. Comparing two carriers by their illustrated rates is the commonest new-agent error.

5. 波动率控制指数:实盘数据怎么说5. Volatility-controlled indices: what the live record shows

除了标普 500,保单里还有一类"波动率控制"指数。 它们把股指期货、国债期货、大宗商品期货混在一起,目标是把波动压低, 换来更高的参与率甚至不封顶。US Pacesetter 和 Balanced Trend 是常见的两个。

Alongside the S&P 500, policies carry "volatility-controlled" indices: blends of equity futures, treasury futures, and commodity futures designed to hold volatility down, in exchange for a higher participation rate or no cap at all. US Pacesetter and Balanced Trend are the two you'll meet.

两件事必须一起讲Two things that must be said together

一、这些指数很新,早年的"表现"是模拟出来的。 US Pacesetter 2021 年 12 月 10 日才正式推出,Balanced Trend 是 2017 年 11 月 20 日; 在这些日期之前的所有表现都是假设性(回测)数据,不是真实发生过的。

One: they're new, and the early "track record" is simulated. US Pacesetter launched on 10 December 2021 and Balanced Trend on 20 November 2017. Anything before those dates is hypothetical back-tested data, not something that actually happened.

二、实盘期间它们大幅跑输。2021 年 12 月到 2026 年 1 月这四年:

Two: in live trading they badly lagged. Over the four years from December 2021 to January 2026:

指数Index四年表现Four-year result
标普 500S&P 500+47.4%
Balanced Trend+0.97%
US Pacesetter−16.0%

把它讲出来,比藏着强。客户迟早会自己查到, 与其那时候解释,不如现在就先说。而且这本身就是选标普 500 策略最有力的论据。

Saying them is better than not. A client will find them eventually, and explaining afterwards is worse than explaining first. Besides, this is the single strongest argument for the S&P 500 strategy.

三、换一个时间窗口,方向还是一样。 看 2021 年 12 月 10 日到 2025 年 3 月 31 日这一段, 下面直接给指数点位,可以自己验算:

Three: a different window, the same direction. Take 10 December 2021 to 31 March 2025. Here are the index levels themselves, so the arithmetic can be checked:

S&P 5004,712.02 → 5,611.85+19.10%
US Pacesetter380.78 → 313−17.80%

两个不同的时间窗口、两套不同的数据, 结论一致:这段实盘期间 US Pacesetter 是亏的,而标普是涨的。 这不是某一次取样的偶然。

Two different windows, two different data sets, and the same conclusion: over these live periods US Pacesetter lost money while the S&P rose. It isn't an artefact of one sampling window.

四、一张真实对账单也是这样。2024 年 9 月 14 日到 2025 年 9 月 14 日,同一张国家人寿保单里: 标普 500 从 5,626.02 涨到 6,584.29(+17.03%),Cap Focus 封顶 9.25%、参与率 105%,记 9.25%; Balanced Trend 从 265.71 到 261.43(−1.61%),US Pacesetter 从 344.46 到 322.96(−6.24%), 两个参与率都是 145%,都记 0。

Four: a real statement says the same. From 14 September 2024 to 14 September 2025, within one National Life policy: the S&P 500 rose from 5,626.02 to 6,584.29 (+17.03%), and Cap Focus, with a 9.25% cap and 105% participation, credited 9.25%; Balanced Trend went from 265.71 to 261.43 (−1.61%) and US Pacesetter from 344.46 to 322.96 (−6.24%), both at 145% participation, both crediting 0.

US Pacesetter 里装的是标普 500 期货、10 年期国债期货和大宗商品期货,按市场阶段换配置: 增长期标普 50%,过渡期 15%,收缩期只有 5%,国债期货升到 65%–75%。它的波动低,就是因为股票的比例常常很低。

US Pacesetter holds S&P 500 futures, 10-year Treasury futures and commodity futures, shifting the mix by market phase: 50% S&P in growth, 15% in the intermediate phase and just 5% in the shrinking phase, with Treasuries at 65%–75%. Its low volatility comes from the stock share often being low.

这些指数存在的真实理由很简单: 波动率受控的指数,对保险公司来说对冲成本更低, 所以才给得起更高的参与率甚至不封顶。 更高的参与率不是白给的,它换来的是一个波动更低、 长期也涨得更少的标的。

The real reason these indices exist is simple: a volatility-controlled index is cheaper for the carrier to hedge, which is what funds the higher participation rate or the absence of a cap. The higher participation rate isn't free. It's bought with an underlying that moves less, and over time rises less too.

6. 增加利息的条款6. The interest-boosting riders

条款Rider数值Values
FlexLife 利息奖金FlexLife interest bonus 保单第 2–9 年区间 0.25%–11.25%;第 10 年起 0.5%–11.5%Years 2–9: a range of 0.25%–11.25%. From year 10: 0.5%–11.5%
SummitLife 利息奖金SummitLife interest bonus 区间 0.5%–11.5%A range of 0.5%–11.5%
SummitLife EnhancersSummitLife Enhancers 把保底和封顶一起抬高,四个档位:
1% → 1.15%,封顶 11% → 11.9%
1% → 1.5%,封顶 11% → 13.5%
1% → 1.75%,封顶 11% → 15.25%
1% → 2%,封顶 11% → 17%
Lifts floor and cap together, in four tiers:
1% → 1.15%, cap 11% → 11.9%
1% → 1.5%, cap 11% → 13.5%
1% → 1.75%, cap 11% → 15.25%
1% → 2%, cap 11% → 17%

算法:先扣费,再计息,再算奖金The arithmetic: charge first, then credit, then bonus

SummitLife 的计算顺序很清楚:费用先从分段价值里扣掉;指数收益按扣费后的价值算; 奖金 = 奖金比例 × 指数收益,但不能超过「上限 × 扣费后的分段价值」。下面是两个例子(假设值,非承诺):

SummitLife's order is clear: the charge comes off the segment value first; the index credit is calculated on what's left; the bonus = bonus rate × index credit, capped at "ceiling × post-charge segment value". Two examples (hypothetical, not a promise):

步骤StepEnhancer PlusEnhancer Max
分段价值Segment value$10,000$10,000
扣费(1% / 3%)Charge (1% / 3%)−$100 → $9,900−$300 → $9,700
指数收益(5% / 10%)Index credit (5% / 10%)$495$970
奖金(50% / 105%)Bonus (50% / 105%)$247.50$1,018.50
奖金上限(4% / 8% × 扣费后价值)Ceiling (4% / 8% × post-charge value)$396,未触及$396, not reached$776,触及$776, binding
当年合计入账Total credited$742.50$1,746
如果指数为 0If the index is 0无收益、无奖金,净减 $100No credit, no bonus, net −$100无收益、无奖金,净减 $300No credit, no bonus, net −$300

两点要记住:一、费用从第 1 年开始扣,奖金从第 2 年开始给;二、奖金比例和上限是当前值,可以下调到保证值,费用却是固定的。 LLD 的当前值与保证值对照见《产品与附约速查》。

Two things to remember: first, charges start in year 1, bonuses in year 2; second, bonus rates and ceilings are current values that can fall to the guaranteed level, while the charge is fixed. LLD's current-vs-guaranteed table is in Products & Riders.

Enhancers 是要收费的(见保单费用), 而且打开 Enhancer 之后,奖金型参与贷款就不能用了 (见保单贷款)。 这三页要连起来看,一个条款的开关会影响另外两块。

Enhancers carry a charge (see Policy Costs), and switching one on makes the declared participating loan unavailable (see Policy Loans). Read the three pages together, because one rider's switch reaches into the other two.

7. IUL 会断保吗7. Can an IUL lapse?

会,但需要两个条件同时发生: 保费没按计划存够,而且利息连续多年是 0。 任一条单独出现通常撑得住,两条叠在一起才出事。

Yes, but it takes two things at once: the premium wasn't funded as planned, and the index credited zero for several consecutive years. Either alone is usually survivable; the pair is what breaks it.

计划书里的保证栏就是把两件事推到极端:一张从小投保、$100 万保额的 Living Life Defender, 累计存 $120,000 后不再存,保证栏每年只按 0.10% 记息、费用按合同上限扣,账户价值第 33 年 $46,296, 第 45 年 $8,629,第 48 年(47 岁)失效。保证栏一定要指给客户看。

The illustration's guaranteed column pushes both to the extreme. A Living Life Defender issued in childhood with a $1M face, funded with $120,000 and then nothing, credited only 0.10% a year with charges at their contractual maximum: $46,296 in year 33, $8,629 in year 45, lapsing in year 48 at age 47. Always point the client to the guaranteed column.

"连续多年是 0"有多罕见How rare several zero years actually is

看标普 500 自 1957 年以来的历史:

The S&P 500's record since 1957:

口径在这里恰恰关键。 IUL 的指数记息一般只看价格指数,不含分红;而「自 1957 年平均超过 10%」 这个说法通常是含分红的总回报口径。拿含分红的平均值去说明一张不含分红、 还要封顶的保单,两边不是同一把尺。要用这组数字,就把它限制在它真正能说明的那件事上: 连续多年下跌很罕见,这一点用价格指数也成立。

The basis is exactly what matters here. IUL crediting generally tracks the price index and excludes dividends, while "over 10% since 1957" is normally a total-return figure that includes them. A dividend-inclusive average doesn't measure a policy that excludes dividends and then caps the result; they aren't the same yardstick. Use the numbers for the one thing they do establish: consecutive down years are rare, which holds on the price index too.

8. 客户的八个问题8. Eight questions clients ask

问题Question怎么答The answer
我会不会亏钱?Can I lose money?钱不是拿去炒股,保险公司只是用指数来算利息。股市跌了本金不亏,最差保证 0%。但要补一句:0% 的年份费用照扣,现金值可能小幅减少。The money isn't in the market; the index only calculates the interest. Principal doesn't fall, with a 0% guarantee at worst. Add the caveat: in a 0% year the charges still come out and cash value can dip.
能赚多少?How much can I make?有上限也有下限。指数涨 15% 可能拿到近 10%。比银行利息高很多,但不会像炒股那样暴涨暴跌。不要报"长期能做到 7%"这种具体数,也不要拿自己保单的实际回报给客户看。要讲数字,就用历史指数表现和计划书上的演示数字。There's a ceiling and a floor. A 15% index year might credit close to 10%. Much better than a savings rate, without the swings of direct equities. Don't quote a specific long-run figure, and don't show a client your own policy's returns. If you need numbers, use the index's actual history and the illustration.
保险公司怎么能又保底又给钱?How can they guarantee a floor and still pay?机制讲清楚就行:大部分钱买债券,小部分钱买期权。债券的利息用来保本,期权用来博指数上涨。封顶就是这么来的:期权买得起多少就封到多少。Explain the mechanism: most of it buys bonds, a small part buys options. The bond interest protects the principal; the options buy the upside, which is why there's a cap. The cap is however much option the budget buys.
保险公司会不会倒闭?Could the carrier fail?受联邦与州两级监管,有再保险公司,还有州级的保证基金垫底。可以配合国家人寿的历史和 2008 年 AIG 的例子讲。Regulated federally and by the state, with reinsurance behind it and a state guaranty association underneath that. It helps to pair this with the carrier's history and the 2008 AIG story.
利息有保证吗?Is the interest guaranteed?下跌时保证不亏,最差 0%,写在合同里,不会出现负利息;上涨时有封顶。The downside is guaranteed: 0% at worst, in the contract, never negative. The upside is capped.
和银行存钱有什么不一样?How is this different from a savings account?银行利息跑不赢通胀(疫情前不到 2%)。保险除了生钱还附带杠杆:出事时能拿出几倍甚至几十倍的钱。区别在这里,不在利率。Savings don't outrun inflation (under 2% before the pandemic). Insurance also carries leverage: multiples of what went in, when something happens. That's the difference, not the rate.
存钱有费用吗?Are there charges?有。完整答法见保单费用那一页的七个常见问题。Yes. The full set of answers is in the seven common questions on Policy Costs.
什么时候能取出来?When can I take money out?头一两年放的钱不建议动。一般 7–10 年后现金值起来了,可以当紧急备用金动用一部分。要做终身退休收入是另一套方案,见保单贷款。Leave the first year or two alone. After roughly seven to ten years there's enough to draw on in an emergency. Lifetime retirement income is a different design, covered in Policy Loans.

9. 当着客户的面怎么讲9. Walking a client through it live

下面是一个四步的现场流程。让客户自己查,比你说一百句有用:

Here is a four-step live sequence. Letting the client look it up beats anything you say:

① 让他自己搜"什么是标普 500"

① Have them search "what is the S&P 500"

百度百科或谷歌都行。信息不是从你嘴里出来的,可信度完全不同。

Baidu Baike or Google. It lands differently when it doesn't come from you.

② 再搜"标普 500 平均回报率"

② Then "S&P 500 average return"

英文客户可以让他搜 "S&P 500 history"。

For English-speaking clients, "S&P 500 history".

③ 打开计划书,翻到指数说明那几页

③ Open the illustration to the index pages

通常在第 22–24 页,但页码随版本变,翻之前自己先确认。

Usually pages 22–24, but that moves between versions, so check first.

④ 保单满一年的,直接开手机 APP 看

④ If the policy is over a year old, open the app

看他自己保单的实际结息记录。这是最有说服力的一步。 注意是看客户自己的保单,不是你的。

Show the actual credits on their own policy. This is the most persuasive step there is. Note that it's their policy, not yours.

10. 一页总结10. One-page summary

  1. 钱不进股市:大部分买债券,小部分买期权,指数只是算利息的尺子。
  2. The money isn't in the market: mostly bonds, a little in options; the index is only the measuring stick.
  3. 保底 0%、封顶有上限,封顶就是保底的价钱。
  4. A 0% floor and a capped ceiling. The cap is what the floor costs.
  5. 年度重置让下跌的年份不用"补回来",这是和股票账户最大的结构差别。
  6. The annual reset means a down year never has to be made up. That's the biggest structural difference from a brokerage account.
  7. 演示利率差一点,高龄阶段差很多(5% 到 6.44%,85 岁接近翻倍)。所以别拿演示利率比公司。
  8. A small difference in the illustrated rate becomes a large one at advanced ages (5% to 6.44% nearly doubles the value at 85). Which is why you don't compare carriers by it.
  9. 波动率控制指数实盘跑输得很难看(四年 −16% 与 +0.97%,对标普 +47.4%),而且早年数据是回测的。主动讲。
  10. The volatility-controlled indices lagged badly in live trading (−16% and +0.97% over four years against +47.4%), and their early data is back-tested. Say it first.
  11. 断保要两个条件同时发生:没按计划存 + 连续多年 0%。后者历史上极罕见。
  12. A lapse takes both: underfunding and several consecutive zero years. The second is historically very rare.
  13. 保底不等于不亏:0% 的年份费用照扣。不报口头收益率,不给客户看自己的保单。
  14. A floor doesn't mean no loss: charges still come out in a 0% year. Never a spoken return figure, never your own policy.
相关Related 保单费用Policy Costs 相关Related 保单贷款Policy Loans

内部培训资料,仅供签约经纪人使用,不可转发给客户。 封顶、参与率、奖金区间与演示利率每年调整,一律以承保公司当期资料和实际计划书为准。 历史指数表现不预示未来结果,本页不构成任何收益承诺。

Internal training material for contracted agents; not for forwarding to clients. Caps, participation rates, bonus ranges, and illustrated rates are revised annually; always use the carrier's current material and the actual illustration. Past index performance does not indicate future results, and nothing here is a promise of any outcome.