



封顶、参与率、奖金区间、演示利率都是成稿时的数值,每年都会调整。 报给客户之前查当期产品说明书和计划书。
Caps, participation rates, bonus ranges, and illustrated rates are as of the time of writing. They are revised every year. Check the current product guide and illustration before quoting.
1. 指数是什么1. What an index is
一个指数就是衡量一篮子股票整体表现的一个数字。 标普 500、上证指数、恒生指数都是这么回事,只是篮子里装的东西不一样。
An index is one number that measures how a basket of stocks did as a whole. The S&P 500, the Shanghai Composite, and the Hang Seng are all the same idea with different baskets.
标普 500The S&P 500
按市值加权的 500 多家美国领先上市公司,苹果、微软、英伟达、谷歌、 亚马逊、特斯拉、沃尔玛这些都在里面。它是衡量美国整体股市表现最好的指标之一, 1957 年推出,是最常被引用的美股指数之一。
Market-cap weighted, made up of 500-plus leading US listed companies, with Apple, Microsoft, Nvidia, Alphabet, Amazon, Tesla, Walmart among them. It's one of the best single measures of the US market; launched in 1957, it's among the most quoted US indices.
成分是会变的,这一点值得跟客户讲。 指数不是一篮子固定的公司放在那儿不动:表现掉队的会被移出,新的领头羊会被加进来。 例如:Tesla 2020 年 12 月加入、Airbnb 与 Blackstone 2023 年 9 月加入、 DoorDash 2025 年 3 月加入;而 Yahoo 2017 年 6 月、Staples 2017 年 9 月、Macy's 2020 年 4 月、 Harley-Davidson 2020 年 6 月被移出。指数本身带有自我更新的机制。
The membership changes, and that's worth saying out loud. An index isn't a fixed set of companies left to drift. Laggards come out and new leaders go in. For example: Tesla joined in December 2020, Airbnb and Blackstone in September 2023, DoorDash in March 2025; Yahoo left in June 2017, Staples in September 2017, Macy's in April 2020 and Harley-Davidson in June 2020. The index refreshes itself.
2. IUL 的核心:跟涨不跟跌2. The core idea: up with the index, not down
下跌保底 Floor
The floor
指数跌的时候,当年利息可能是 0%,但不会是负数。 有句口号叫「零就是英雄 Zero is Hero」。
When the index falls, the year may credit 0%, but never a negative. The phrase for it: zero is hero.
上涨封顶 Cap
The cap
涨的时候有上限。保底不是白给的,封顶就是保底的价钱。 这句话一定要主动说,别等客户自己发现。
The upside is capped. The floor isn't free: the cap is what the floor costs. Say it first; don't let the client find it themselves.
为什么「不亏」这么值钱Why "not losing" is worth so much
因为亏损和收益不对称。$100,000 亏 50% 剩 $50,000, 要回到 $100,000 需要的不是 50% 而是 100% 的收益。
Because losses and gains are asymmetric. $100,000 down 50% is $50,000. Getting back to $100,000 takes not 50% but 100%.
- 2000–2002 互联网泡沫:高点到低点约 −49%,2000 年的高点到 2007 年才涨回来。
- The dot-com crash, 2000–2002: about −49% peak to trough; the 2000 high was regained in 2007.
- 2008 次贷危机:全年 −38.49%,2007 年的高点只看价格指数要到 2013 年才涨回来(含分红约 2012 年)。
- The 2008 crisis: −38.49% for the year; the 2007 high wasn't regained on the price index until 2013 (about 2012 with dividends).
年度重置 Annual ResetThe annual reset
每年的利息一旦结算就锁定。下跌的年份不需要"补回去", 这一年的年终价值直接成为下一年的起始价值。 所以 IUL 不存在"先把之前跌掉的补回来才开始赚"这件事,而股票账户有。
Once a year's interest is credited it is locked. A down year never has to be made up. This year's ending value simply becomes next year's starting value. There is no "dig out of the hole first" the way there is in a brokerage account.
1970 年代的真实数据可以演示:1970 年底各放 $100,000,一个跟着标普 500 涨跌,一个按封顶 9.25%、保底 0% 年度重置。 1973、1974 年石油危机标普连跌 17.37% 和 29.72%,标普账户从 $128,106 掉到 $74,394;年度重置账户停在 $119,356。 1975 年标普反弹 31.55%,标普账户只回到 $97,866,年度重置账户直接从 $119,356 往上记到 $130,396;1976 年两边是 $116,607 对 $142,458。 这段年份对年度重置特别有利,在 1995–1999 这种连续大涨的年份,有封顶的账户会明显落后。
The 1970s show it with real data. Put $100,000 into each of two accounts at the end of 1970: one follows the S&P 500, the other resets annually with a 9.25% cap and 0% floor. In the 1973–74 oil crisis the S&P fell 17.37% and then 29.72%, taking its account from $128,106 to $74,394; the reset account held at $119,356. In 1975 the S&P bounced 31.55%, yet its account only reached $97,866, while the reset account credited straight up from $119,356 to $130,396. By 1976 it stood at $116,607 versus $142,458. That stretch flatters the reset; in long strong runs such as 1995–1999, a capped account falls well behind.
3. 封顶与参与率3. Cap and participation rate
两个旋钮,决定同一个指数涨幅最后变成多少利息:
Two dials turn the same index move into different credited interest:
- 封顶 Cap:这一年最多算到多少。
- The cap: the most that can be credited in a year.
- 参与率 Participation Rate:指数涨幅乘以一个比例。 算例:指数涨 3%,参与率 105% 就是 3 × 10⁵% = 3.15%; 参与率 140% 就是 3 × 140% = 4.2%。
- The participation rate: a multiplier on the index move. For example, a 3% index year at 105% credits 3 × 10⁵% = 3.15%; at 140% it credits 3 × 140% = 4.2%.
国家人寿的策略之间就是在这两个旋钮上做取舍: 有的封顶更高,有的参与率更高但封顶低, 还有的把保底从 0% 抬到 1%、代价是封顶更低。 结论是:封顶更高的标普 500 策略长期平均回报更高。 过去 20 年里标普 500 有 13 年涨幅超过 8.5%,高封顶才吃得到这些年份。 计划书的历史演示(现在的参数加 Enhancer 加成,套 2005–2024 年)20 年几何平均:Cap Focus 7.88%, Participation Focus 6.37%,1% Floor 6.68%;同期标普价格涨幅是 8.20%,比任何一个 IUL 策略都高。
National Life's strategies trade these two against each other: some carry a higher cap, some a higher participation rate with a lower cap, and one lifts the floor from 0% to 1% at the cost of a lower cap. The upshot: the higher-cap S&P 500 strategy has the better long-run average. In the last twenty years the index gained more than 8.5% in thirteen of them, and only a high cap captures those. A proposal's historical illustration (today's parameters plus the Enhancer bonus, applied to 2005–2024) gives twenty-year geometric averages of 7.88% for Cap Focus, 6.37% for Participation Focus and 6.68% for 1% Floor; the S&P's own price return over the same years was 8.20%, above every IUL strategy.
4. 演示利率:差一点,差很多4. The illustrated rate: a small gap that grows
计划书上那个"演示利率"受 AG49 规范约束,不是随便填的。 但它对结果的影响大到惊人。下面这个案例是反着看的。 同样 40 岁女性、$100 万身故保额,问的是要达到这个保额,每月得存多少:
The illustrated rate on a proposal is constrained by AG49, so it isn't a free choice. Its effect is still startling. The example below runs it backwards: same female age 40, same $1M death benefit, asking how much a month it takes to get there:
| 演示利率Illustrated rate | 所需月缴保费Monthly premium required |
|---|---|
| 5% | $885.95 |
| 6% | $687.30 |
| 6.44% | $622.26 |
正着看:同样存 $6 万/年存 4 年,演示利率越高,账户价值越高,而且时间越长差得越多。
Forwards: on the same $60,000 a year for four years, a higher rate means a higher account value, and the gap widens with time.
| 演示利率Illustrated rate | 65 岁账户价值Value at 65 | 85 岁账户价值Value at 85 |
|---|---|---|
| 5% | $650,272 | $1,841,138 |
| 6% | $833,925(+28%)$833,925 (+28%) | $2,866,887(+56%)$2,866,887 (+56%) |
| 6.44% | $928,619(+43%)$928,619 (+43%) | $3,468,087(约 1.9 倍)$3,468,087 (about 1.9×) |
各家公司的演示利率也不一样(成稿时):国家人寿标普 Cap Focus 6.81%,Symetra 标普 7.00%, F&G 标普 7.19%,Transamerica 7.70%。差不到一个百分点,计划书就能差出上面这么多。
Carriers illustrate at different rates too (as of writing): National Life S&P Cap Focus 6.81%, Symetra S&P 7.00%, F&G S&P 7.19%, Transamerica 7.70%. Less than a point apart, and the illustrations differ by as much as the tables above.
5% 到 6%,85 岁时多 56%;5% 到 6.44%,差 1.44 个百分点,接近翻倍。
From 5% to 6% adds 56% at age 85; from 5% to 6.44%, a 1.44-point step, comes close to doubling it.
所以两件事同时成立:① 演示利率高的方案在纸面上永远更好看; ② 纸面好看不等于将来真的做得到。 这正是《保单费用》里那六条"事先约定"的最后一条:预估表只是预估表。 拿演示利率去比两家公司的方案,是新人最常犯的错。
Two things are true at once: (1) a higher illustrated rate always looks better on paper, and (2) looking better on paper is not the same as happening. This is exactly the last of the six things to settle before an IUL sale: an illustration is an illustration. Comparing two carriers by their illustrated rates is the commonest new-agent error.
5. 波动率控制指数:实盘数据怎么说5. Volatility-controlled indices: what the live record shows
除了标普 500,保单里还有一类"波动率控制"指数。 它们把股指期货、国债期货、大宗商品期货混在一起,目标是把波动压低, 换来更高的参与率甚至不封顶。US Pacesetter 和 Balanced Trend 是常见的两个。
Alongside the S&P 500, policies carry "volatility-controlled" indices: blends of equity futures, treasury futures, and commodity futures designed to hold volatility down, in exchange for a higher participation rate or no cap at all. US Pacesetter and Balanced Trend are the two you'll meet.
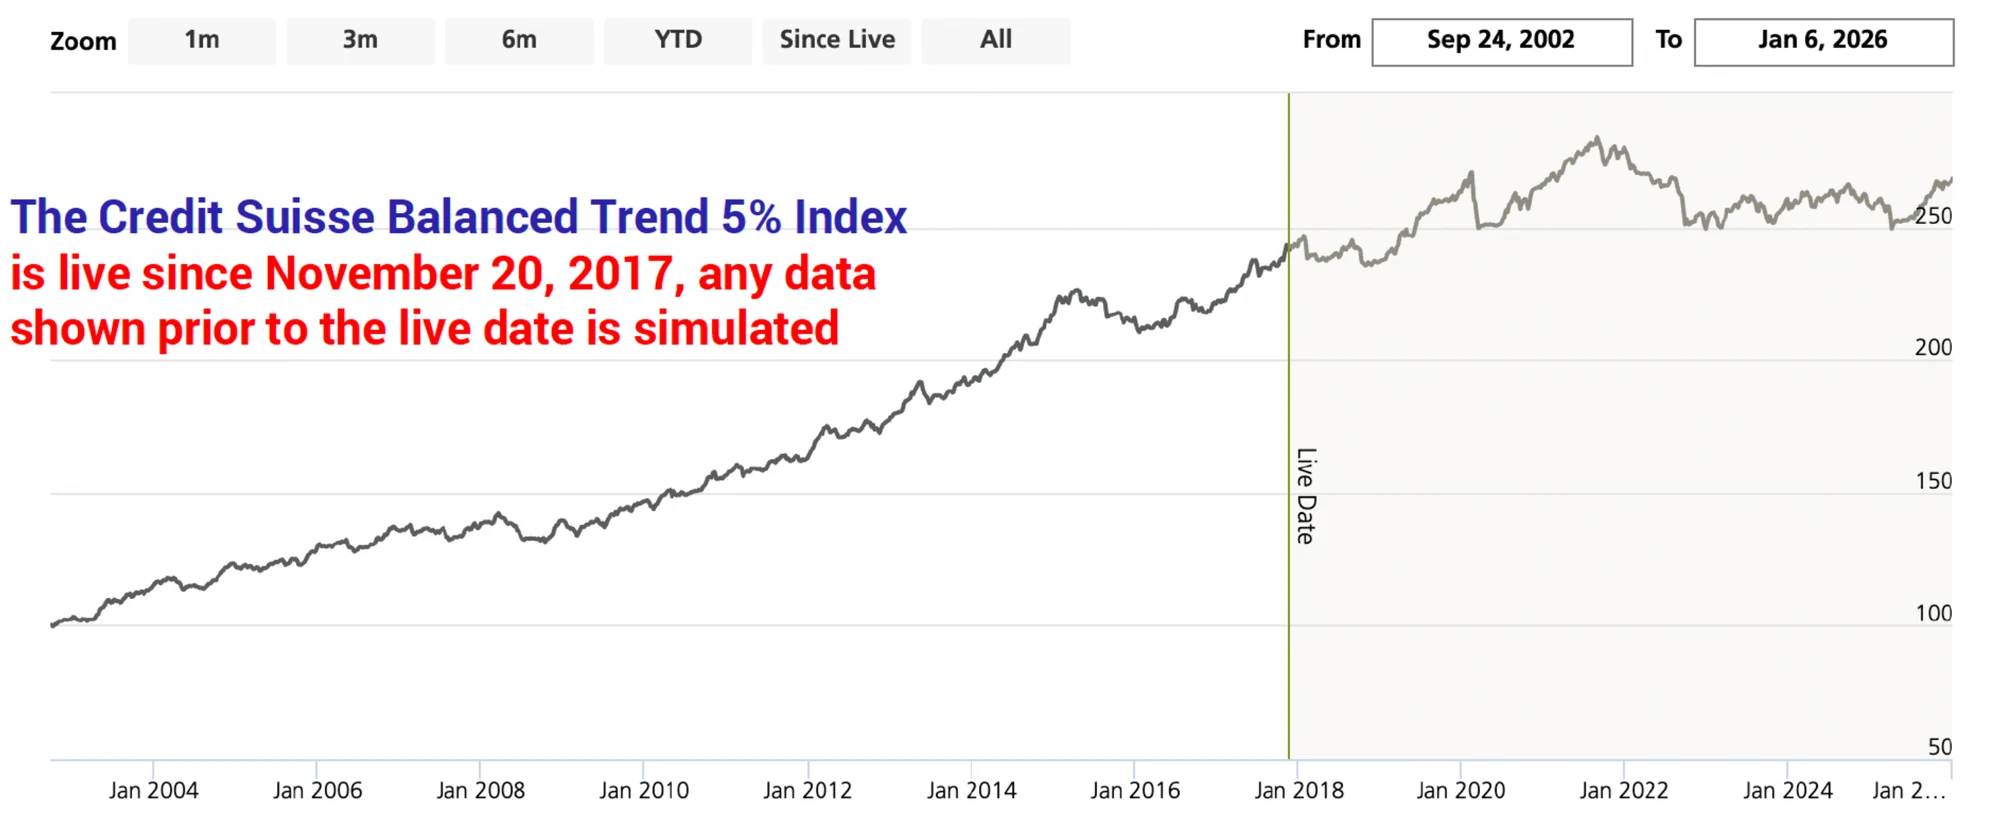
一、这些指数很新,早年的"表现"是模拟出来的。 US Pacesetter 2021 年 12 月 10 日才正式推出,Balanced Trend 是 2017 年 11 月 20 日; 在这些日期之前的所有表现都是假设性(回测)数据,不是真实发生过的。
One: they're new, and the early "track record" is simulated. US Pacesetter launched on 10 December 2021 and Balanced Trend on 20 November 2017. Anything before those dates is hypothetical back-tested data, not something that actually happened.
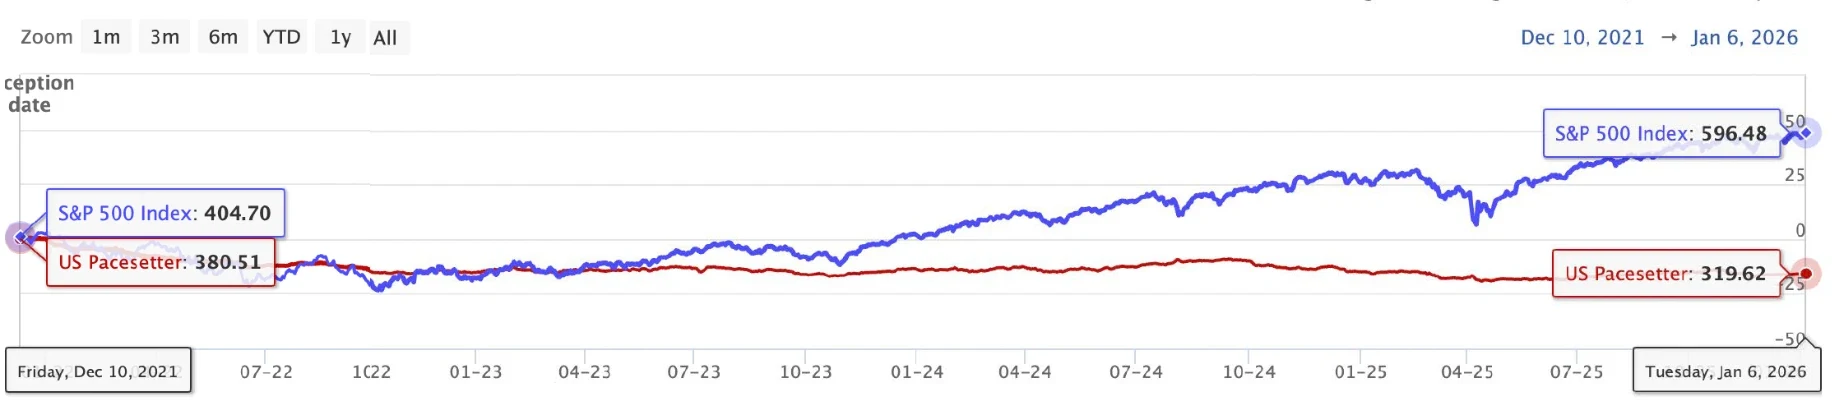
二、实盘期间它们大幅跑输。2021 年 12 月到 2026 年 1 月这四年:
Two: in live trading they badly lagged. Over the four years from December 2021 to January 2026:
| 指数Index | 四年表现Four-year result |
|---|---|
| 标普 500S&P 500 | +47.4% |
| Balanced Trend | +0.97% |
| US Pacesetter | −16.0% |
把它讲出来,比藏着强。客户迟早会自己查到, 与其那时候解释,不如现在就先说。而且这本身就是选标普 500 策略最有力的论据。
Saying them is better than not. A client will find them eventually, and explaining afterwards is worse than explaining first. Besides, this is the single strongest argument for the S&P 500 strategy.
三、换一个时间窗口,方向还是一样。 看 2021 年 12 月 10 日到 2025 年 3 月 31 日这一段, 下面直接给指数点位,可以自己验算:
Three: a different window, the same direction. Take 10 December 2021 to 31 March 2025. Here are the index levels themselves, so the arithmetic can be checked:
| S&P 500 | 4,712.02 → 5,611.85 | +19.10% |
| US Pacesetter | 380.78 → 313 | −17.80% |
两个不同的时间窗口、两套不同的数据, 结论一致:这段实盘期间 US Pacesetter 是亏的,而标普是涨的。 这不是某一次取样的偶然。
Two different windows, two different data sets, and the same conclusion: over these live periods US Pacesetter lost money while the S&P rose. It isn't an artefact of one sampling window.
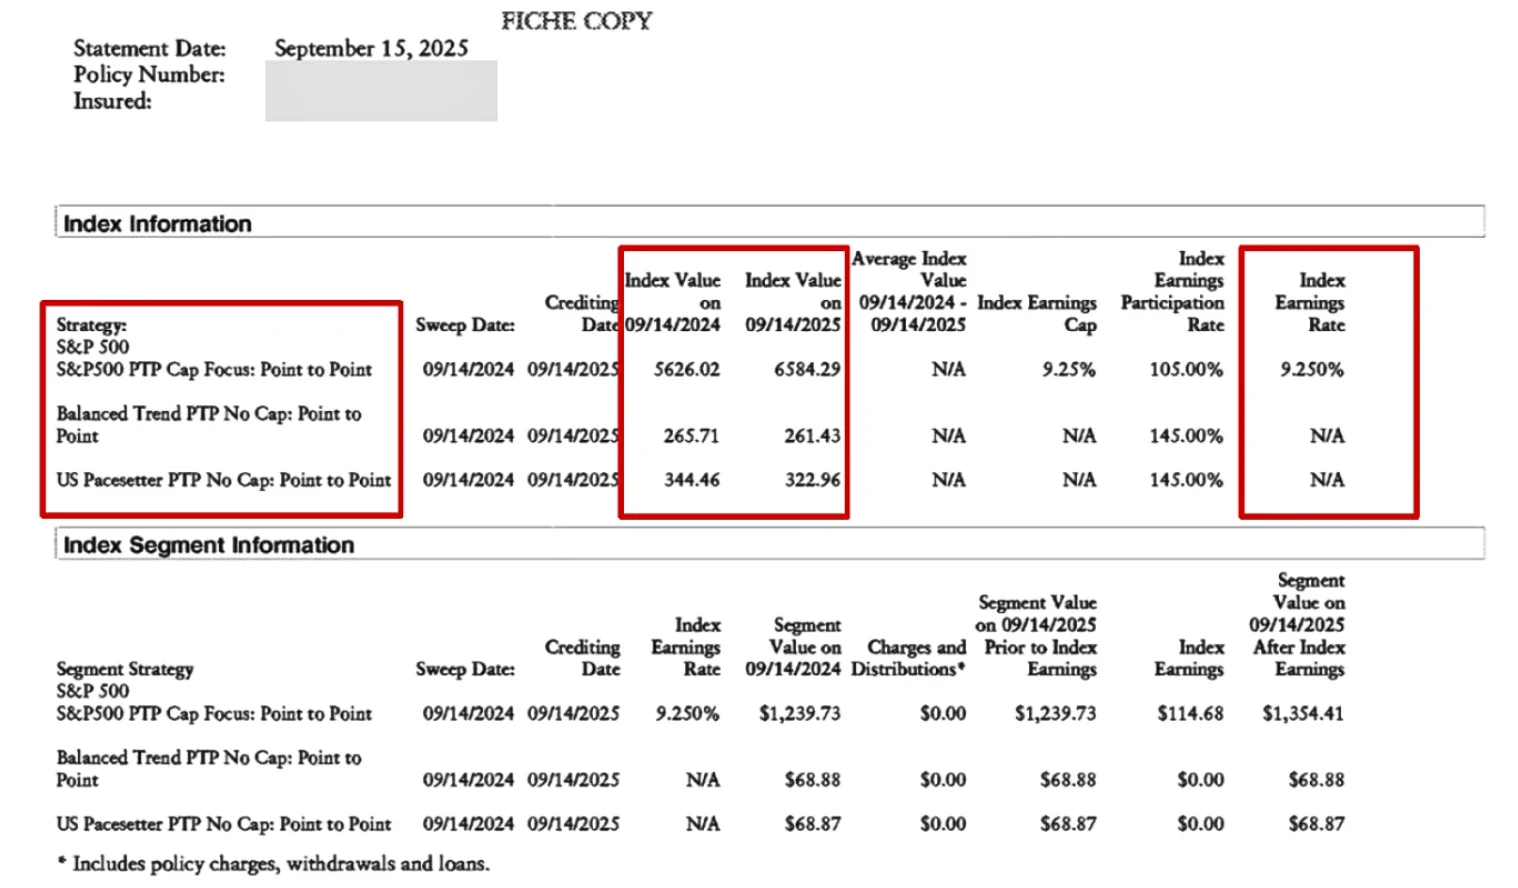
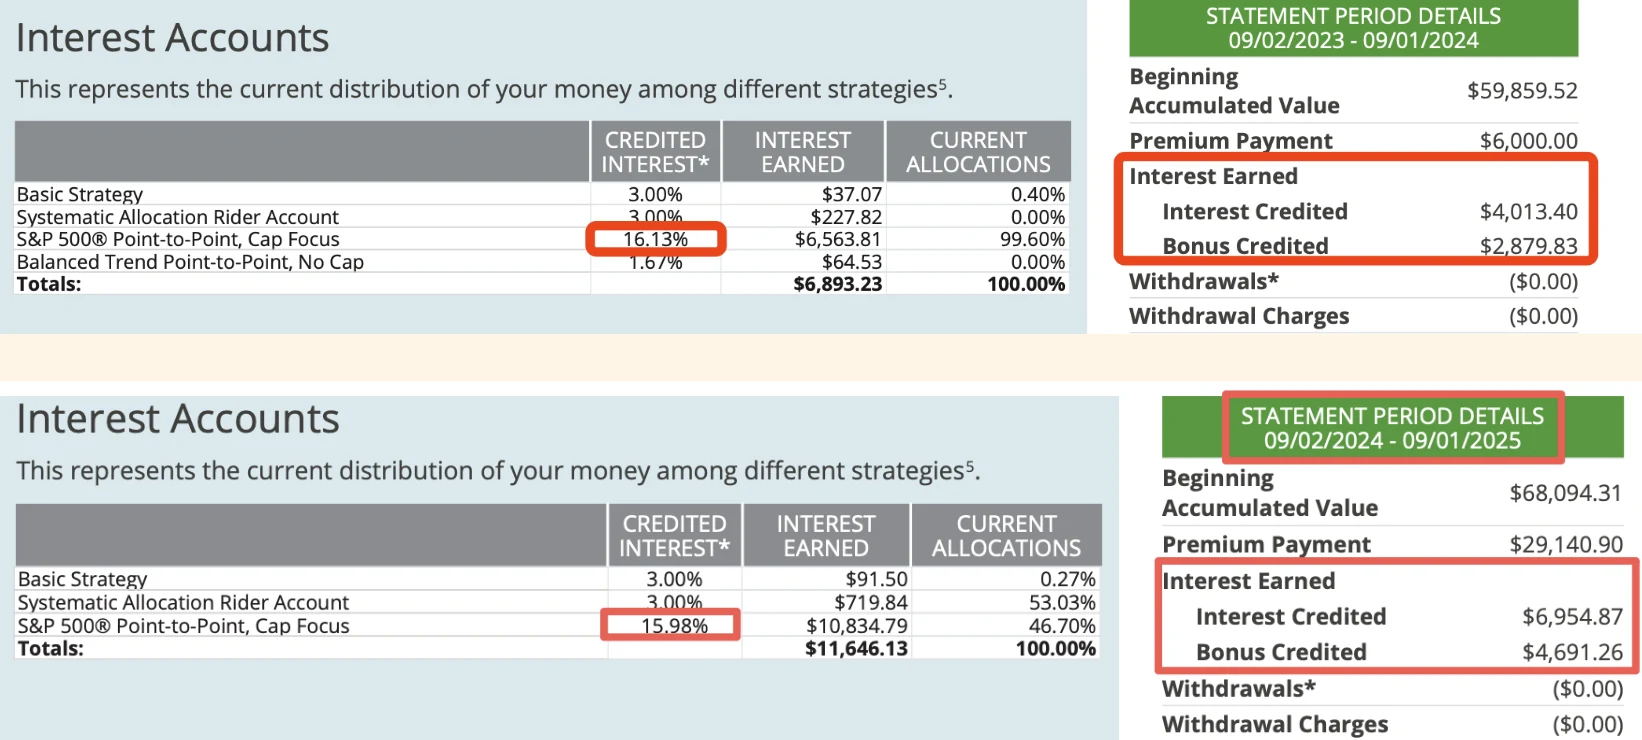
四、一张真实对账单也是这样。2024 年 9 月 14 日到 2025 年 9 月 14 日,同一张国家人寿保单里: 标普 500 从 5,626.02 涨到 6,584.29(+17.03%),Cap Focus 封顶 9.25%、参与率 105%,记 9.25%; Balanced Trend 从 265.71 到 261.43(−1.61%),US Pacesetter 从 344.46 到 322.96(−6.24%), 两个参与率都是 145%,都记 0。
Four: a real statement says the same. From 14 September 2024 to 14 September 2025, within one National Life policy: the S&P 500 rose from 5,626.02 to 6,584.29 (+17.03%), and Cap Focus, with a 9.25% cap and 105% participation, credited 9.25%; Balanced Trend went from 265.71 to 261.43 (−1.61%) and US Pacesetter from 344.46 to 322.96 (−6.24%), both at 145% participation, both crediting 0.
US Pacesetter 里装的是标普 500 期货、10 年期国债期货和大宗商品期货,按市场阶段换配置: 增长期标普 50%,过渡期 15%,收缩期只有 5%,国债期货升到 65%–75%。它的波动低,就是因为股票的比例常常很低。
US Pacesetter holds S&P 500 futures, 10-year Treasury futures and commodity futures, shifting the mix by market phase: 50% S&P in growth, 15% in the intermediate phase and just 5% in the shrinking phase, with Treasuries at 65%–75%. Its low volatility comes from the stock share often being low.
这些指数存在的真实理由很简单: 波动率受控的指数,对保险公司来说对冲成本更低, 所以才给得起更高的参与率甚至不封顶。 更高的参与率不是白给的,它换来的是一个波动更低、 长期也涨得更少的标的。
The real reason these indices exist is simple: a volatility-controlled index is cheaper for the carrier to hedge, which is what funds the higher participation rate or the absence of a cap. The higher participation rate isn't free. It's bought with an underlying that moves less, and over time rises less too.
6. 增加利息的条款6. The interest-boosting riders
| 条款Rider | 数值Values |
|---|---|
| FlexLife 利息奖金FlexLife interest bonus | 保单第 2–9 年区间 0.25%–11.25%;第 10 年起 0.5%–11.5%Years 2–9: a range of 0.25%–11.25%. From year 10: 0.5%–11.5% |
| SummitLife 利息奖金SummitLife interest bonus | 区间 0.5%–11.5%A range of 0.5%–11.5% |
| SummitLife EnhancersSummitLife Enhancers | 把保底和封顶一起抬高,四个档位: 1% → 1.15%,封顶 11% → 11.9% 1% → 1.5%,封顶 11% → 13.5% 1% → 1.75%,封顶 11% → 15.25% 1% → 2%,封顶 11% → 17% Lifts floor and cap together, in four tiers: 1% → 1.15%, cap 11% → 11.9% 1% → 1.5%, cap 11% → 13.5% 1% → 1.75%, cap 11% → 15.25% 1% → 2%, cap 11% → 17% |
算法:先扣费,再计息,再算奖金The arithmetic: charge first, then credit, then bonus
SummitLife 的计算顺序很清楚:费用先从分段价值里扣掉;指数收益按扣费后的价值算; 奖金 = 奖金比例 × 指数收益,但不能超过「上限 × 扣费后的分段价值」。下面是两个例子(假设值,非承诺):
SummitLife's order is clear: the charge comes off the segment value first; the index credit is calculated on what's left; the bonus = bonus rate × index credit, capped at "ceiling × post-charge segment value". Two examples (hypothetical, not a promise):
| 步骤Step | Enhancer Plus | Enhancer Max |
|---|---|---|
| 分段价值Segment value | $10,000 | $10,000 |
| 扣费(1% / 3%)Charge (1% / 3%) | −$100 → $9,900 | −$300 → $9,700 |
| 指数收益(5% / 10%)Index credit (5% / 10%) | $495 | $970 |
| 奖金(50% / 105%)Bonus (50% / 105%) | $247.50 | $1,018.50 |
| 奖金上限(4% / 8% × 扣费后价值)Ceiling (4% / 8% × post-charge value) | $396,未触及$396, not reached | $776,触及$776, binding |
| 当年合计入账Total credited | $742.50 | $1,746 |
| 如果指数为 0If the index is 0 | 无收益、无奖金,净减 $100No credit, no bonus, net −$100 | 无收益、无奖金,净减 $300No credit, no bonus, net −$300 |
两点要记住:一、费用从第 1 年开始扣,奖金从第 2 年开始给;二、奖金比例和上限是当前值,可以下调到保证值,费用却是固定的。 LLD 的当前值与保证值对照见《产品与附约速查》。
Two things to remember: first, charges start in year 1, bonuses in year 2; second, bonus rates and ceilings are current values that can fall to the guaranteed level, while the charge is fixed. LLD's current-vs-guaranteed table is in Products & Riders.
Enhancers 是要收费的(见保单费用), 而且打开 Enhancer 之后,奖金型参与贷款就不能用了 (见保单贷款)。 这三页要连起来看,一个条款的开关会影响另外两块。
Enhancers carry a charge (see Policy Costs), and switching one on makes the declared participating loan unavailable (see Policy Loans). Read the three pages together, because one rider's switch reaches into the other two.
7. IUL 会断保吗7. Can an IUL lapse?
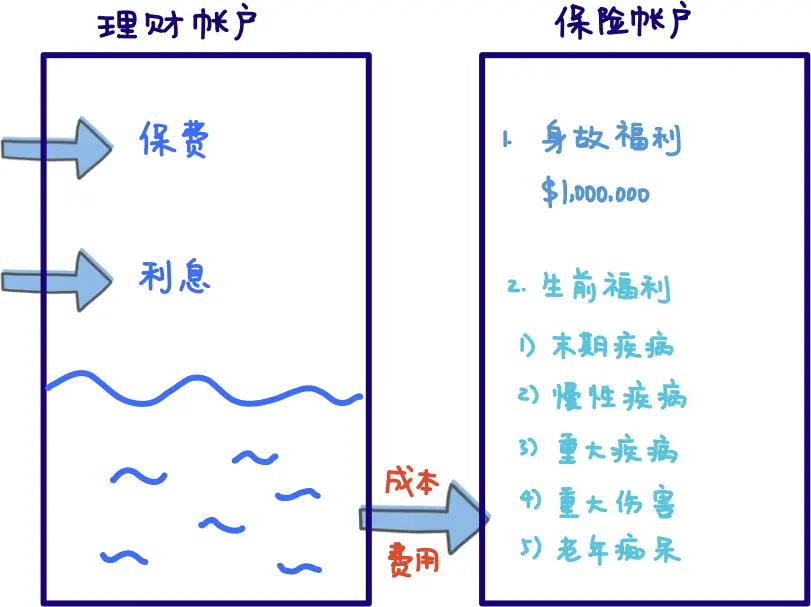
会,但需要两个条件同时发生: 保费没按计划存够,而且利息连续多年是 0。 任一条单独出现通常撑得住,两条叠在一起才出事。
Yes, but it takes two things at once: the premium wasn't funded as planned, and the index credited zero for several consecutive years. Either alone is usually survivable; the pair is what breaks it.
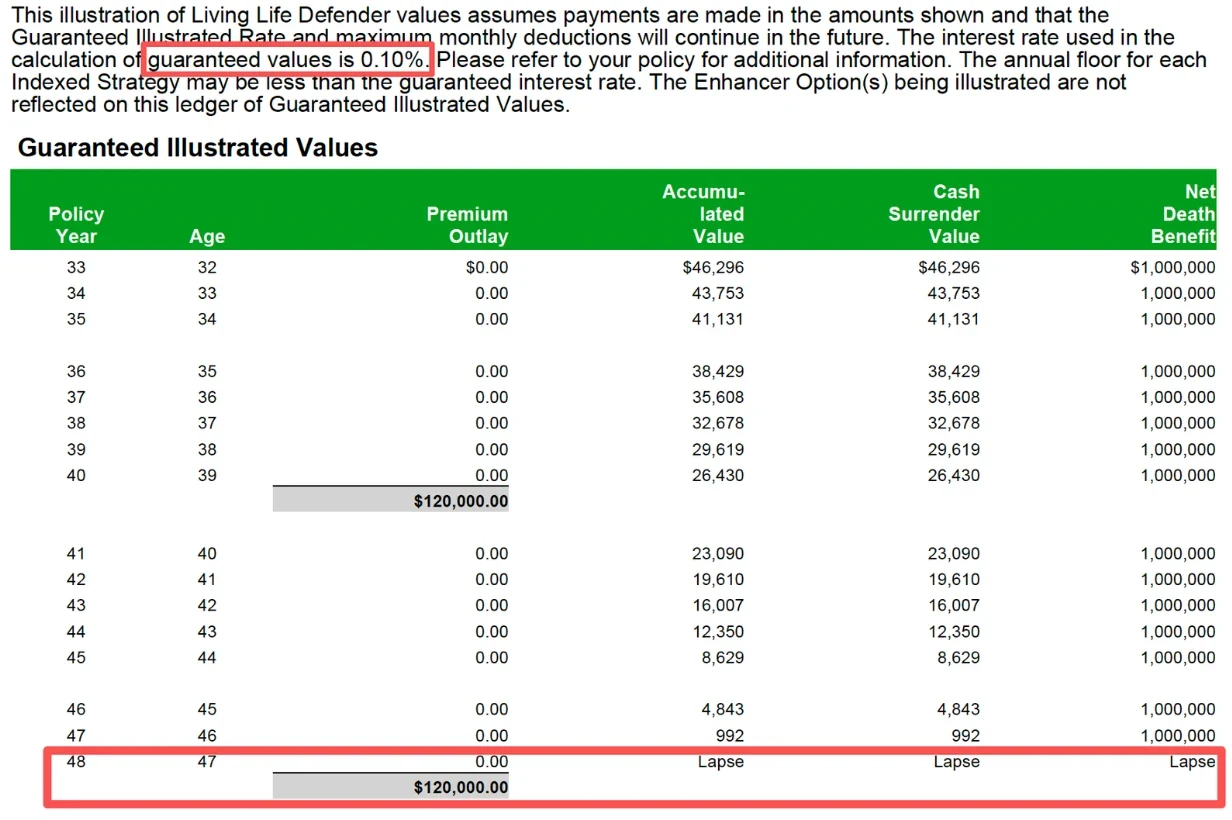
计划书里的保证栏就是把两件事推到极端:一张从小投保、$100 万保额的 Living Life Defender, 累计存 $120,000 后不再存,保证栏每年只按 0.10% 记息、费用按合同上限扣,账户价值第 33 年 $46,296, 第 45 年 $8,629,第 48 年(47 岁)失效。保证栏一定要指给客户看。
The illustration's guaranteed column pushes both to the extreme. A Living Life Defender issued in childhood with a $1M face, funded with $120,000 and then nothing, credited only 0.10% a year with charges at their contractual maximum: $46,296 in year 33, $8,629 in year 45, lapsing in year 48 at age 47. Always point the client to the guaranteed column.
"连续多年是 0"有多罕见How rare several zero years actually is
看标普 500 自 1957 年以来的历史:
The S&P 500's record since 1957:
- 连续 3 年下跌:只发生过一次(2000、2001、2002 年,互联网泡沫)。
- Three consecutive down years: once (2000, 2001, 2002).
- 连续 2 年下跌:只发生过一次(1973、1974 年,石油危机)。
- Two consecutive down years: once (1973 and 1974).
- 自 1957 年以来平均年回报超过 10%。
- The average annual return since 1957 is above 10%.
口径在这里恰恰关键。 IUL 的指数记息一般只看价格指数,不含分红;而「自 1957 年平均超过 10%」 这个说法通常是含分红的总回报口径。拿含分红的平均值去说明一张不含分红、 还要封顶的保单,两边不是同一把尺。要用这组数字,就把它限制在它真正能说明的那件事上: 连续多年下跌很罕见,这一点用价格指数也成立。
The basis is exactly what matters here. IUL crediting generally tracks the price index and excludes dividends, while "over 10% since 1957" is normally a total-return figure that includes them. A dividend-inclusive average doesn't measure a policy that excludes dividends and then caps the result; they aren't the same yardstick. Use the numbers for the one thing they do establish: consecutive down years are rare, which holds on the price index too.
8. 客户的八个问题8. Eight questions clients ask
| 问题Question | 怎么答The answer |
|---|---|
| 我会不会亏钱?Can I lose money? | 钱不是拿去炒股,保险公司只是用指数来算利息。股市跌了本金不亏,最差保证 0%。但要补一句:0% 的年份费用照扣,现金值可能小幅减少。The money isn't in the market; the index only calculates the interest. Principal doesn't fall, with a 0% guarantee at worst. Add the caveat: in a 0% year the charges still come out and cash value can dip. |
| 能赚多少?How much can I make? | 有上限也有下限。指数涨 15% 可能拿到近 10%。比银行利息高很多,但不会像炒股那样暴涨暴跌。不要报"长期能做到 7%"这种具体数,也不要拿自己保单的实际回报给客户看。要讲数字,就用历史指数表现和计划书上的演示数字。There's a ceiling and a floor. A 15% index year might credit close to 10%. Much better than a savings rate, without the swings of direct equities. Don't quote a specific long-run figure, and don't show a client your own policy's returns. If you need numbers, use the index's actual history and the illustration. |
| 保险公司怎么能又保底又给钱?How can they guarantee a floor and still pay? | 机制讲清楚就行:大部分钱买债券,小部分钱买期权。债券的利息用来保本,期权用来博指数上涨。封顶就是这么来的:期权买得起多少就封到多少。Explain the mechanism: most of it buys bonds, a small part buys options. The bond interest protects the principal; the options buy the upside, which is why there's a cap. The cap is however much option the budget buys. |
| 保险公司会不会倒闭?Could the carrier fail? | 受联邦与州两级监管,有再保险公司,还有州级的保证基金垫底。可以配合国家人寿的历史和 2008 年 AIG 的例子讲。Regulated federally and by the state, with reinsurance behind it and a state guaranty association underneath that. It helps to pair this with the carrier's history and the 2008 AIG story. |
| 利息有保证吗?Is the interest guaranteed? | 下跌时保证不亏,最差 0%,写在合同里,不会出现负利息;上涨时有封顶。The downside is guaranteed: 0% at worst, in the contract, never negative. The upside is capped. |
| 和银行存钱有什么不一样?How is this different from a savings account? | 银行利息跑不赢通胀(疫情前不到 2%)。保险除了生钱还附带杠杆:出事时能拿出几倍甚至几十倍的钱。区别在这里,不在利率。Savings don't outrun inflation (under 2% before the pandemic). Insurance also carries leverage: multiples of what went in, when something happens. That's the difference, not the rate. |
| 存钱有费用吗?Are there charges? | 有。完整答法见保单费用那一页的七个常见问题。Yes. The full set of answers is in the seven common questions on Policy Costs. |
| 什么时候能取出来?When can I take money out? | 头一两年放的钱不建议动。一般 7–10 年后现金值起来了,可以当紧急备用金动用一部分。要做终身退休收入是另一套方案,见保单贷款。Leave the first year or two alone. After roughly seven to ten years there's enough to draw on in an emergency. Lifetime retirement income is a different design, covered in Policy Loans. |
9. 当着客户的面怎么讲9. Walking a client through it live
下面是一个四步的现场流程。让客户自己查,比你说一百句有用:
Here is a four-step live sequence. Letting the client look it up beats anything you say:
① 让他自己搜"什么是标普 500"
① Have them search "what is the S&P 500"
百度百科或谷歌都行。信息不是从你嘴里出来的,可信度完全不同。
Baidu Baike or Google. It lands differently when it doesn't come from you.
② 再搜"标普 500 平均回报率"
② Then "S&P 500 average return"
英文客户可以让他搜 "S&P 500 history"。
For English-speaking clients, "S&P 500 history".
③ 打开计划书,翻到指数说明那几页
③ Open the illustration to the index pages
通常在第 22–24 页,但页码随版本变,翻之前自己先确认。
Usually pages 22–24, but that moves between versions, so check first.
④ 保单满一年的,直接开手机 APP 看
④ If the policy is over a year old, open the app
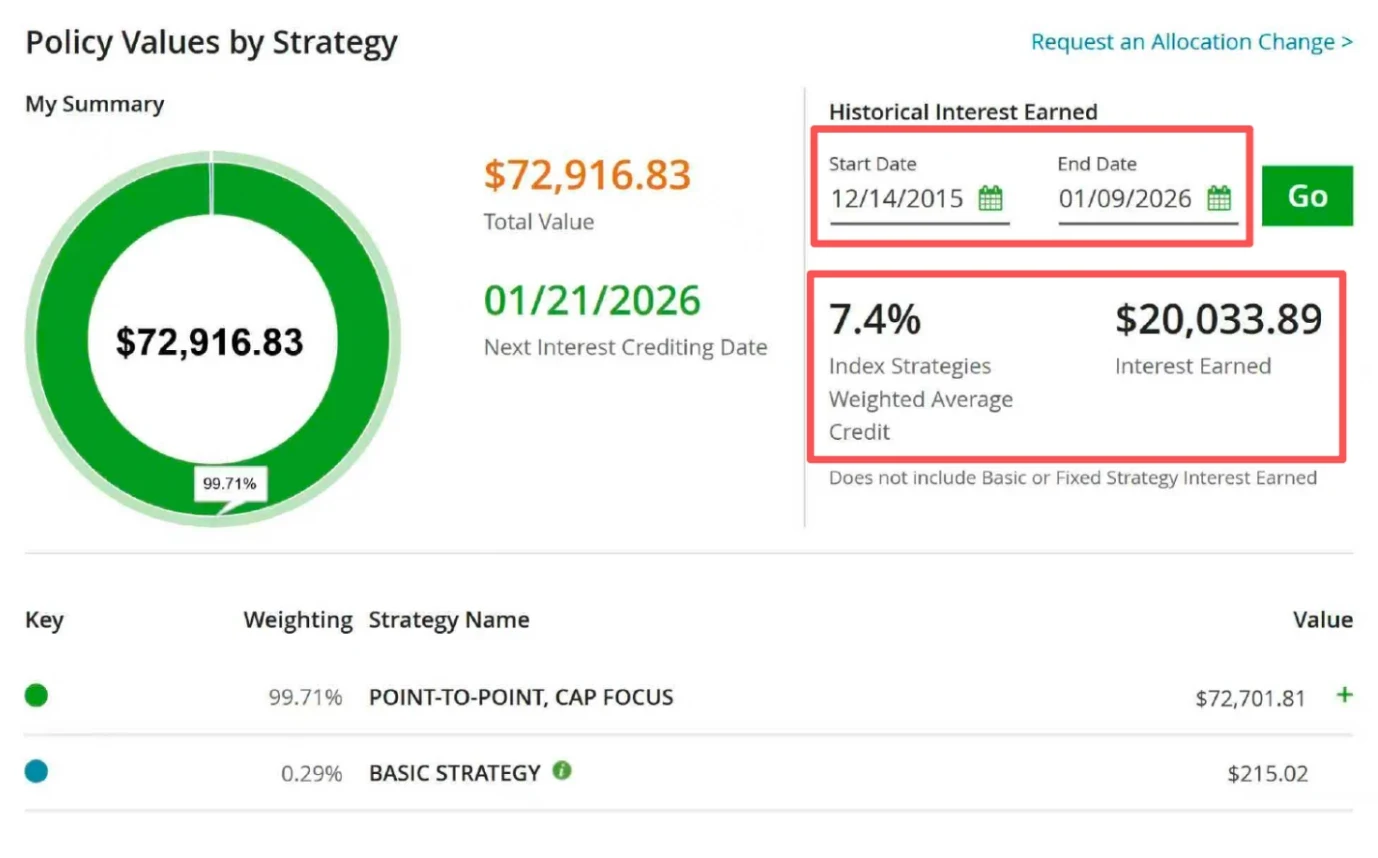
看他自己保单的实际结息记录。这是最有说服力的一步。 注意是看客户自己的保单,不是你的。
Show the actual credits on their own policy. This is the most persuasive step there is. Note that it's their policy, not yours.
10. 一页总结10. One-page summary
- 钱不进股市:大部分买债券,小部分买期权,指数只是算利息的尺子。
- The money isn't in the market: mostly bonds, a little in options; the index is only the measuring stick.
- 保底 0%、封顶有上限,封顶就是保底的价钱。
- A 0% floor and a capped ceiling. The cap is what the floor costs.
- 年度重置让下跌的年份不用"补回来",这是和股票账户最大的结构差别。
- The annual reset means a down year never has to be made up. That's the biggest structural difference from a brokerage account.
- 演示利率差一点,高龄阶段差很多(5% 到 6.44%,85 岁接近翻倍)。所以别拿演示利率比公司。
- A small difference in the illustrated rate becomes a large one at advanced ages (5% to 6.44% nearly doubles the value at 85). Which is why you don't compare carriers by it.
- 波动率控制指数实盘跑输得很难看(四年 −16% 与 +0.97%,对标普 +47.4%),而且早年数据是回测的。主动讲。
- The volatility-controlled indices lagged badly in live trading (−16% and +0.97% over four years against +47.4%), and their early data is back-tested. Say it first.
- 断保要两个条件同时发生:没按计划存 + 连续多年 0%。后者历史上极罕见。
- A lapse takes both: underfunding and several consecutive zero years. The second is historically very rare.
- 保底不等于不亏:0% 的年份费用照扣。不报口头收益率,不给客户看自己的保单。
- A floor doesn't mean no loss: charges still come out in a 0% year. Never a spoken return figure, never your own policy.
内部培训资料,仅供签约经纪人使用,不可转发给客户。 封顶、参与率、奖金区间与演示利率每年调整,一律以承保公司当期资料和实际计划书为准。 历史指数表现不预示未来结果,本页不构成任何收益承诺。
Internal training material for contracted agents; not for forwarding to clients. Caps, participation rates, bonus ranges, and illustrated rates are revised annually; always use the carrier's current material and the actual illustration. Past index performance does not indicate future results, and nothing here is a promise of any outcome.